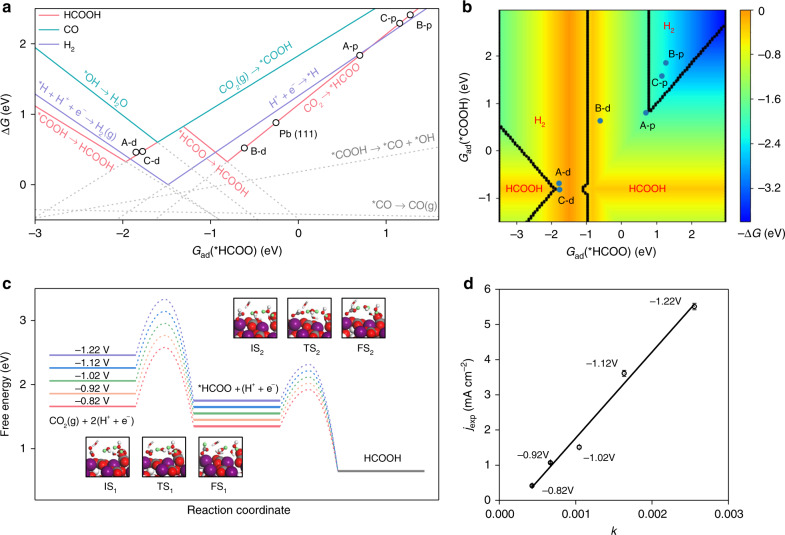
Fig. 4. Theoretically simulated the activity and selectivity of hydrocerussite.
a Reaction free energies of involved elementary reactions plot versus Gad(*HCOO). b Two-dimensional map of activity and selectivity for CO2RR. Different regions represent different products, and colors represent the negative ΔG of GDS measured as the label on the right side. c Free energy diagrams of CO2RR into HCOOH under different experimental potentials; insets are structures of initial (IS), transition (TS) and final (FS) state of CO2 protonation (1) and HCOOH formation (2); purple, red, gray, and white atoms are Pb, O, C, and H, respectively; green atoms represent H that participate in the reaction. d Experimental partial current density of formate (jexp) versus theoretical charge transfer rate k (10−17 C ∙ s−1 ∙ site−1). Error bars correspond to the standard error of the mean.

