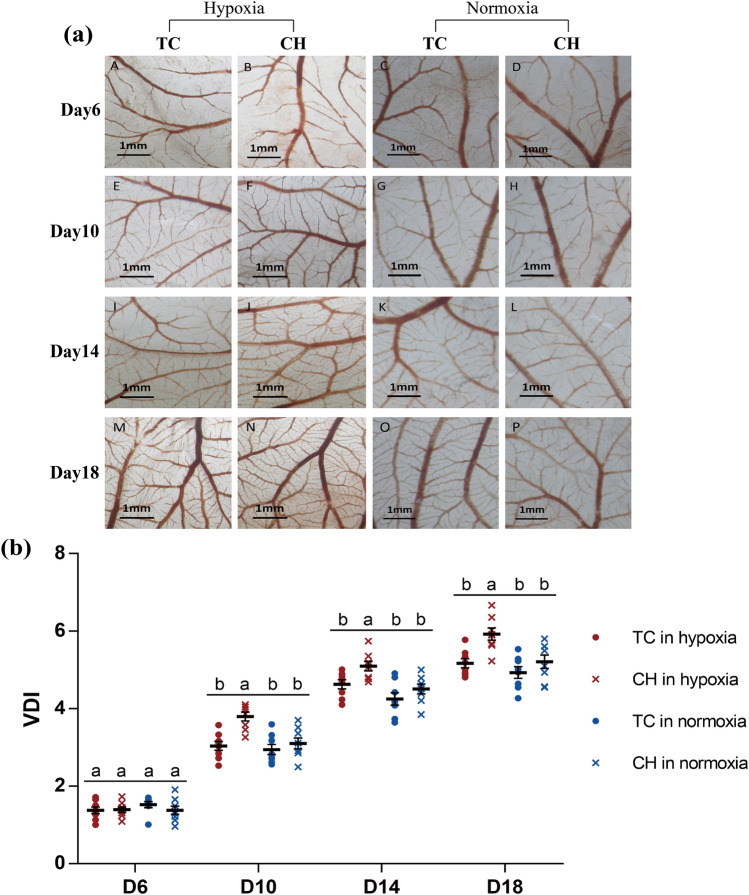
Figure 1.
Vascularity of CAM during incubation. (a) Panels A to P are representative photomicrographs for days 6, 10, 14, and 18 of incubation, showing CAMs that had been exposed to hypoxic and normoxic conditions; (b) the quantitative comparisons of VDI under hypoxic and normoxic conditions, all values are represented as the mean ± standard error. Values labeled with the same letter (a, b) do not differ significantly; values labeled with different letters show significant differences at P < 0.05. Red color represents chickens incubated in hypoxic condition and blue color represent chickens incubated in normoxic condition. CAM chorioallantoic membrane, VDI vascular density index, TC Tibetan chicken, CH Chahua chicken.

