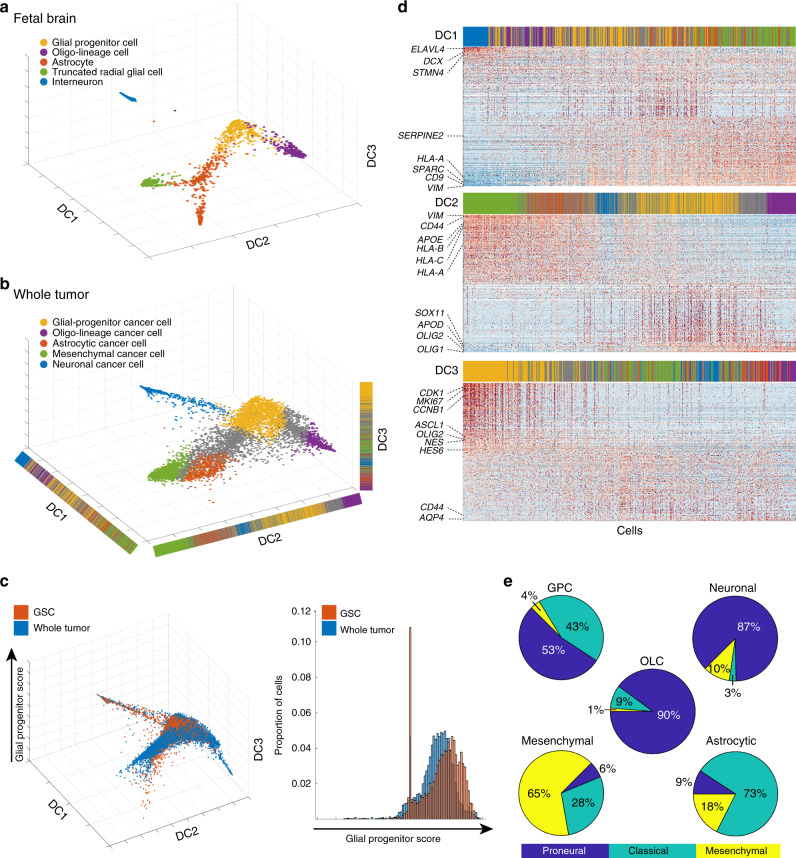
Fig. 3. Fetal brain roadmap reveals a glioblastoma trilineage hierarchy centered on progenitor cancer cells.
a Diffusion plot of the projection of selected fetal cell types onto the roadmap. Cells are colored by the cell type they were attributed in Fig. 2a. b Diffusion plot of the projection of an equal number of whole-tumor cancer cells from each patient onto the roadmap. Cells are colored based on their classification by linear discriminant analysis (LDA). Unclassified cells were colored gray. c Diffusion plot showing the location of glioma stem cells (GSCs) relative to whole-tumor cells (left) and histogram of glial progenitor score for GSCs and whole-tumor cells (right). An increase in proportion of cells with higher glial progenitor scores is seen in GSCs (p < 1e-21, two-sample Kolmogorov–Smirnov test). Only samples with paired GSC and whole-tumor data were used here. d Heatmaps showing relative gene expression (raw data) for cells ordered by each of the diffusion components of the roadmap. Genes are ordered from most correlated to least correlated with the diffusion component. The 200 most and 200 least correlated genes are shown. Top color bar indicates cell type classification from the LDA. Each color corresponds to the same classification as in b. e Pie chart for TCGA subtype by cell type for a subset of 1000 cells. Cell types are based on the LDA classification for all whole-tumor cells. and TCGA subtype was obtained using Gliovis (see Methods).

