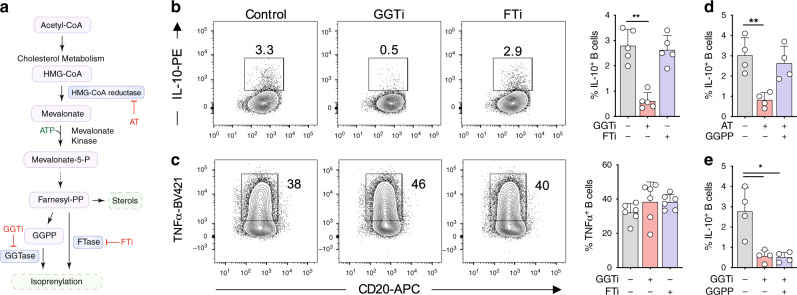
Fig. 2. Cholesterol metabolism drives IL-10 via GGPP.
a Schematic diagram showing key metabolites and enzymes of the isoprenylation route in cholesterol metabolism. b, c IL-10 (b) and TNF (c) expression in human B cells after stimulation through TLR9 ± geranylgeranyl transferase inhibition (GGTi, GGTi-298) ± farnesyl transferase inhibition (FTi, FTi-277) (n = 5 for IL-10, pval = 0.001; n = 6 for TNF). d IL-10 expression in human B cells after stimulation through TLR9 ± atorvastatin (AT) ± geranylgeranyl pyrophosphate (GGPP) (n = 4, pval = 0.009). e IL-10 expression in human B cells after stimulation through TLR9 ± GGTi ± GGPP (n = 4, pval both 0.03). Each data point represents individual donors. All data presented are mean ± SD. Statistical testing in all figures was done by a Friedman’s test with Dunns’s multiple comparisons test. *P < 0.05, **P < 0.01, and all significant values are shown.

