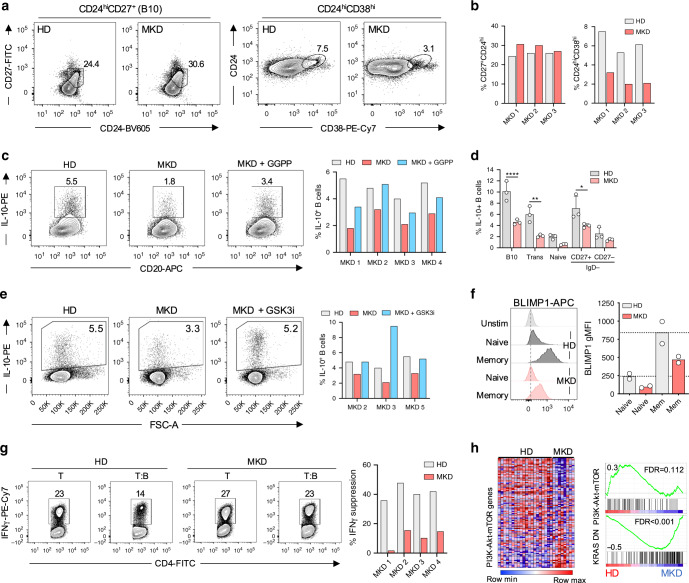
Fig. 6. MKD patients generate weak regulatory B-cell responses.
a, b Frequencies of B10 (CD24hiCD27+) and CD24hiCD38hi regulatory B cells in mevalonate kinase deficient (MKD) patients, compared to age and sex matched healthy donors (HD). c IL-10 expression in MKD patients and HD after stimulation through TLR9 ± geranylgeranyl pyrophosphate (GGPP). d IL-10 expression within B10, CD24hiCD38hi, naïve, and memory populations, showing the differential contribution of B cell phenotypes to IL-10 production (n = 3, pval = <0.0001, 0.002, and 0.01). e IL-10 expression in MKD patients and HD after stimulation through TLR9 ± GSK3i (CHIR-99021). f BLIMP1 expression in naïve and memory HD or MKD patient B cells after stimulation through TLR9 (n = 2). g IFNγ production in human CD4+ T cells of healthy controls and MKD patients after co-culture with autologous TLR9-activated B cells. Protocol is outlined in Fig. 1c. h Gene set enrichment analysis conducted on gene expression profiles from an independent dataset (GSE43553) on PBMCs ex vivo in MKD patients (n = 8) or HD (n = 20). Heatmap shows all genes involved in “Hallmark” PI3K-Akt-mTOR gene set collection from MSigDB, and their relative expression in MKD vs. HD. Enrichment plots show PI3K-Akt-mTOR and KRAS DN (genes downregulated by KRAS activation) in MKD vs. HD. Each data point represents individual donors. All data presented are mean ± SD where average values are shown. Statistical analysis in (d) was conducted using a paired t test. *P < 0.05, **P < 0.01, ***P < 0.001, ****P < 0.0001 and all significant values are shown.

