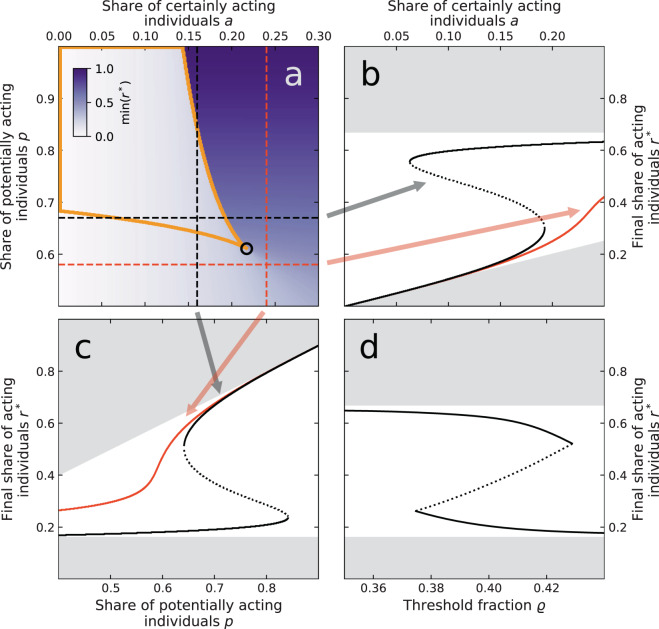
Figure 4.
Bifurcation analysis and hysteresis of the refined Granovetter model with an emergent threshold distribution as given by the analytical approximation. (a) Smallest stable fixed point min(r*) for different shares of certainly acting and potentially acting individuals . The black circle denotes a cusp-bifurcation. Black dashed horizontal/vertical lines correspond to the diagrams in (b,c) that show a saddle-node bifurcation. For (b–d), solid (dotted) lines indicate stable (unstable) fixed points r*. Grey shading indicates those areas where and that can thus not be reached. The yellow circled area in (a) indicates the bistable regime. Red dashed horizontal/vertical lines in (a) correspond to values of p and a at which no bifurcation is observed and thus r* varies smoothly in (b,c). (d) Shows the bifurcation diagram in the threshold fraction . Fixed parameters are: for (c) ( for the red curve) and (d), for (b) ( for the red curve) and (d), and for (a–c).

