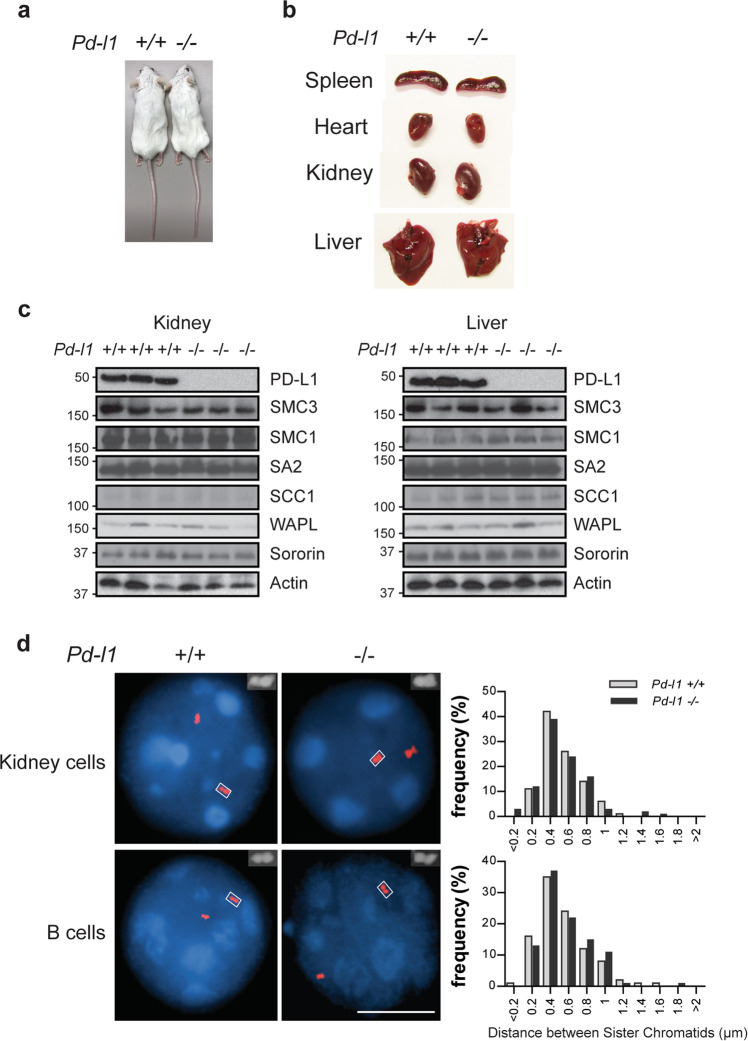
Fig. 5. Pd-l1 knockout mice display normal phenotypes including sister chromatid cohesion.
a Image of Pd-l1 WT (+/+) and KO (−/−) mice. b Comparison of organ sizes between the Pd-l1 WT (+/+) and KO (−/−) mice. c Protein expression of cohesin subunits in kidney or liver tissues from the Pd-l1 WT (+/+) and KO (−/−) mice. d Representative images of FISH assays to determine sister chromatid cohesion in primary kidney cells and B cells isolated from the Pd-l1 WT (+/+) and KO (−/−) mice. Scale bar: 10 µm.

