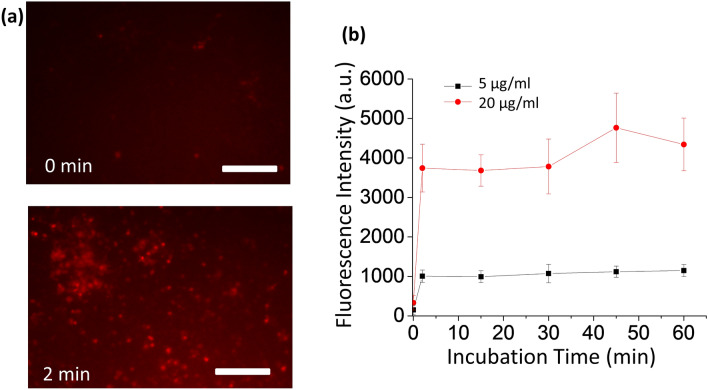
Figure 2.
MIRB Nanoparticle Localization to Neural Cells. (a) Fluorescent images of clusters of neurons before exposure to MIRB nanoparticles (0 min, top insert) and after 2 min of MIRB exposure followed by the removal of free particles (2 min, bottom insert). Scale bar is 100 µm. (b) Kinetics of MIRB association with neurons measured by fluorescent images of MIRB nanoparticles. Neurons were incubated with MIRB nanoparticles at either 5 or 20 µg/ml for the specified duration before removal of free particles. Each error bar denotes the standard deviation of the mean values of all ROIs at a given time point and dose.

