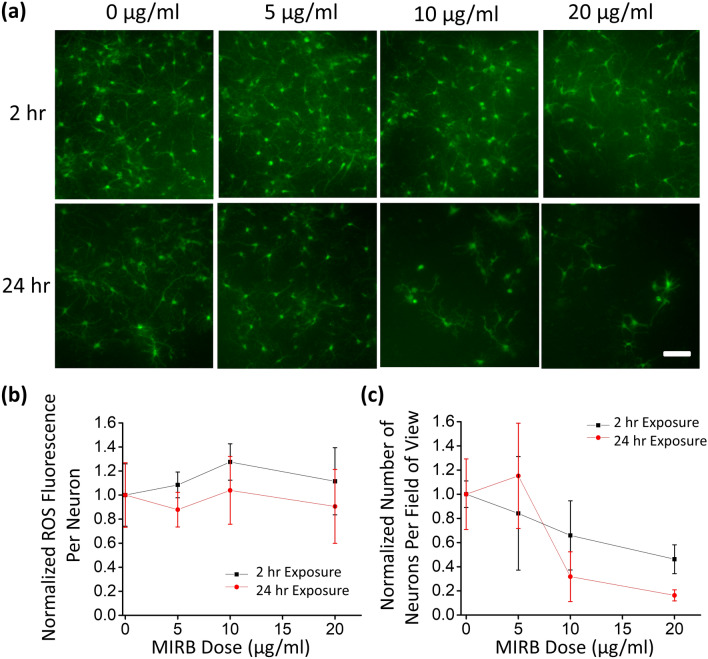
Figure 3.
ROS staining of neurons for ROS and viability measurements. (a) DIV19 neurons were incubated with MIRB nanoparticles for 2 h (top row) or 24 h (bottom row) at dosages of 0 µg/ml (control), 5 µg/ml, 10 µg/ml or 20 µg/ml. Live neurons were fluorescently observed with a fluorometric intracellular ROS kit (green) particularly sensitive to superoxide and hydroxyl radicals. Scale bar is 100 µm. (b) Plot of the ROS fluorescence intensity per neuron normalized against that of the control. (c) Plot of the number of fluorescent neurons per field of view normalized against that of the control. Each error bar denotes the standard deviation of the mean values of the replicate wells at a given time point and dose.

