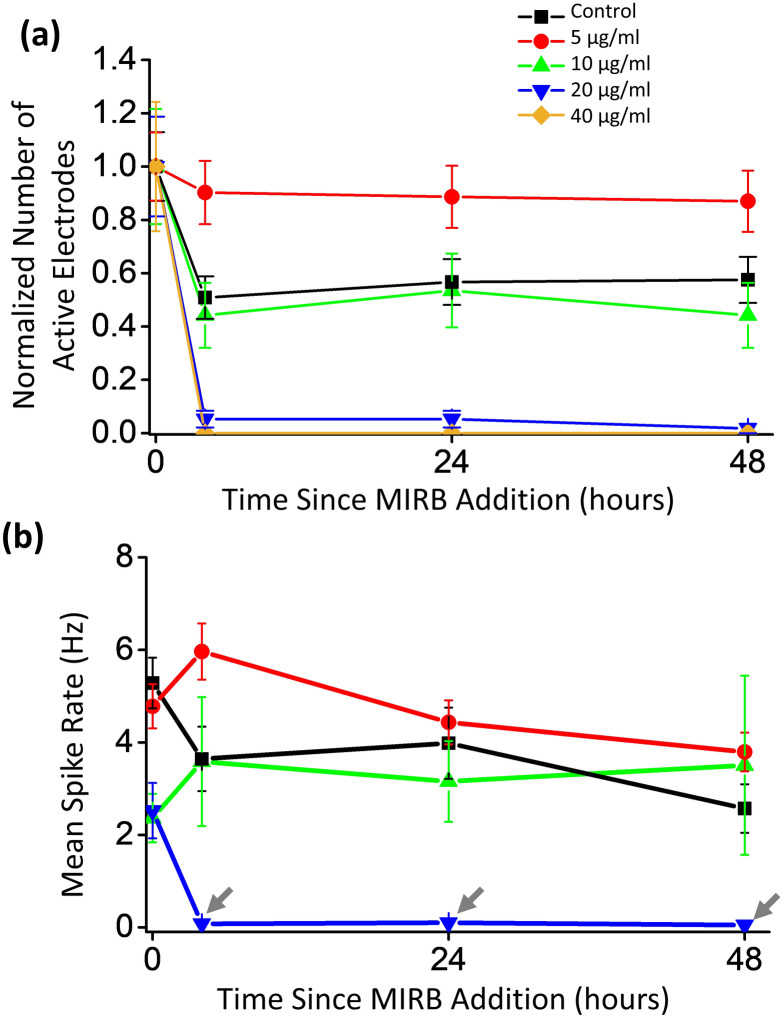
Figure 5.
Dose-dependent active electrode count and mean spike rate versus time for MEA neuron cultures. (a) Plot of total number of active electrodes versus time, normalized to the total number of active electrodes originally spiking at a given MIRB dose at 0 h (pretreatment). For each dose, MIRB nanoparticles were incubated for 2 h before removal. At the dose of 40 µg/ml, no active electrodes were detected at 4 h or later and those MEA data were not further analyzed. We found that prior to incubation with 0 (control), 5, 10, 20, or 40 µg/ml MIRB nanoparticles, there were 30, 41, 15, 19, and 17 active electrodes (> 0.03 Hz) per MEA on average (out of 60 possible electrodes), respectively. Error bars are Poisson counting errors. (b) Mean spike rates of active electrodes versus time. Error bars denote standard error of the mean.

