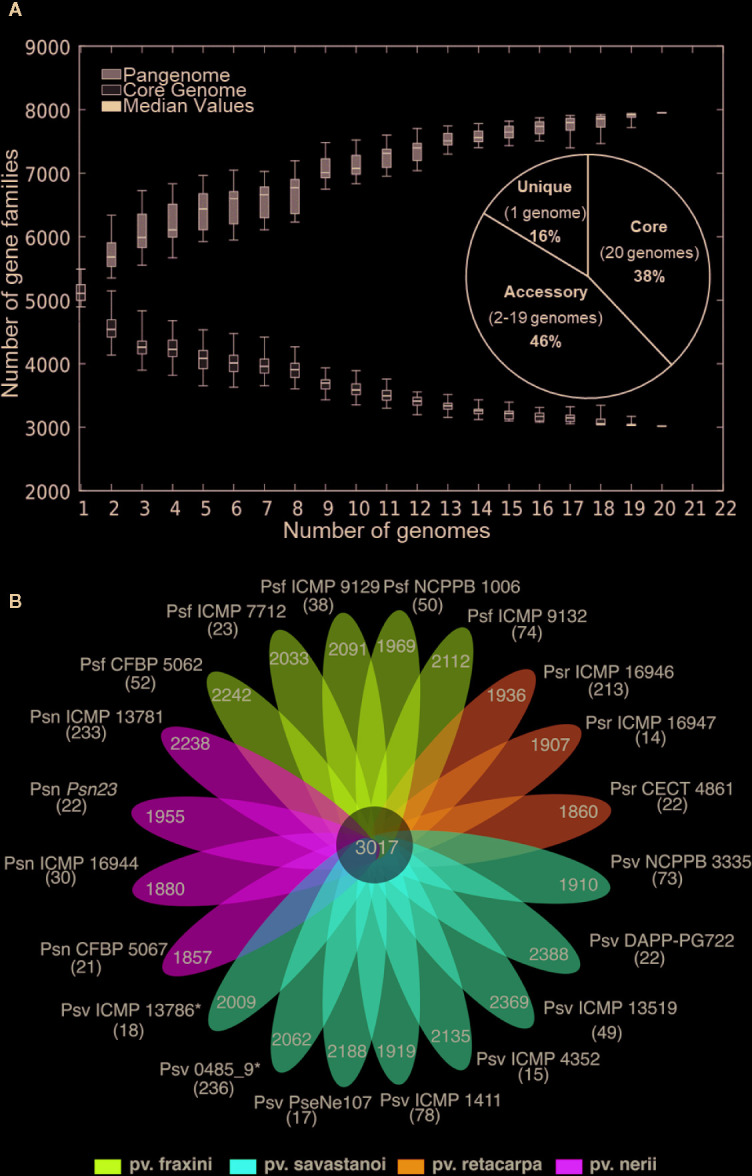
Figure 1.

(A) Core- and pan-genome of P. savastanoi strains. Boxes indicate changes in number of gene families to the number of genes added sequentially, with median values denoted with a horizontal black line and standard deviation with vertical bars. The pie chart shows the frequency distribution of ortholog groups of genes. (B) Strain-specific P. savastanoi genes. Number of genes in the core-genome (center), accessory genes (petals) and strain-specific genes (in brackets), calculated using BPGA. Psv, Psn, Psf, and Psr, P. savastanoi pathovars savastanoi, nerii, fraxini, and retacarpa, respectively. Asterisks indicate oleander strains included in Psv (see Figure 4 ).
