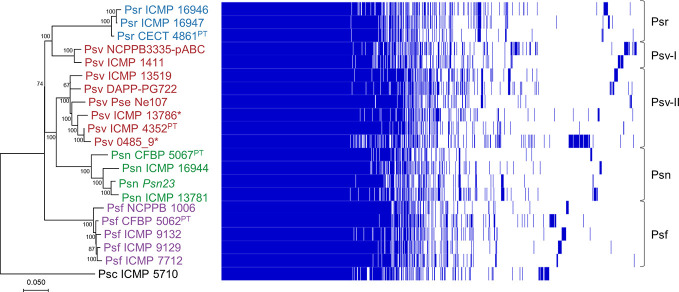
Figure 2.
Phylogeny and gene content of P. savastanoi genomes. Maximum likelihood tree based on core genome SNPs, rooted with P. syringae pv. ciccaronei ICMP 5710. Values in nodes are bootstrap percentages from 100 replicates; the scale represents substitutions per site (left panel). Heat map representing presence (blue) or absence (blank) of individual genes (right panel). Strain abbreviations as in Figure 1 ; PT, pathotype strain.

