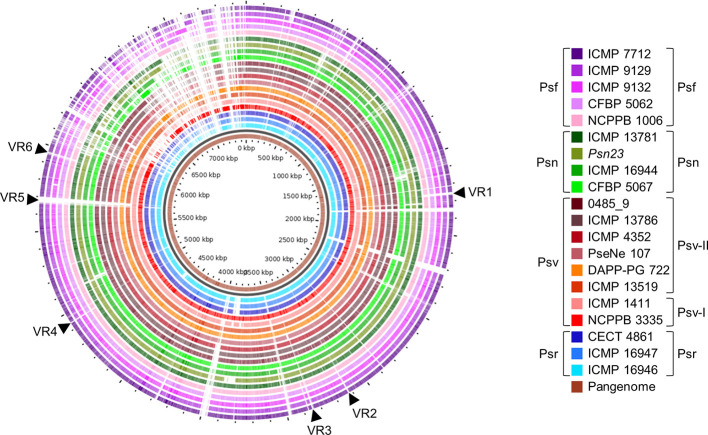
Figure 8.
Genomic comparison of Pseudomonas savastanoi pathovars. Comparison made using the GView Pangenome analysis tool. Black arrows, selected variable regions (VR) that could be pathovar-specific (see Supplementary Figure S1 ). Strain abbreviations as in Figure 1 , indicating the phylogenetic grouping from Figure 2 to the right of the legend.

