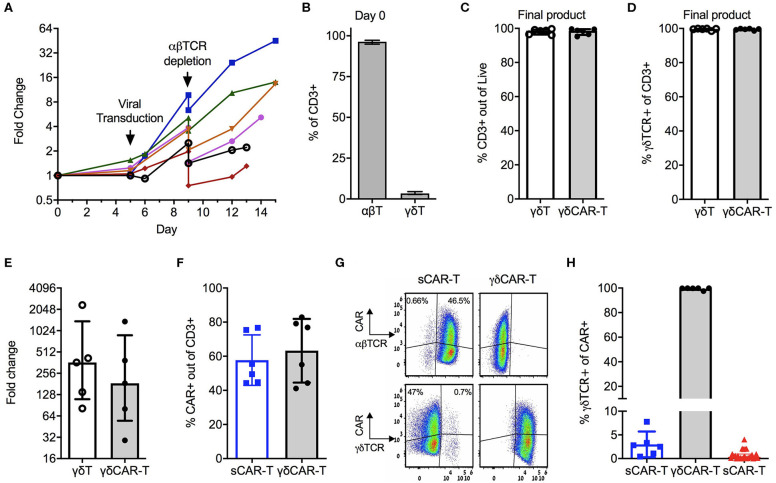
Figure 1.
Production of γδCAR-T cells: (A) Production scheme, showing total cell expansion (by fold change) along the protocol. Day 0 is the collection of blood, PBMCs isolation, and T cell activation. Each line represents a different healthy donor. (B) γδ-T/ αβ-T cells composition of donors' blood out of CD3 positive cells (n = 5). (C) CD3 positive cells in the final product of un-transduced γδ-T and transduced γδCAR-T cells (n = 6). (D) Purity of γδTCR+ cells in the final product of both protocols (n = 6). (E) γδ-T cells fold change expansion during the γδCAR-T production protocol (n = 5). (F) CAR transduction efficiency by flow cytometry gated on CD3 positive cells, of the standard CAR (sCAR) and γδCAR-T cell products (n = 6). (G) Dot plots of a representative sample showing CAR expression in γδ and αβ-T cells populations in the final product of sCAR and γδCAR-T cell protocols. (H) γδTCR positive cells gated on CAR positive cells in the final composition of sCAR-T cells (blue squares, n = 6), γδCAR-T cells production protocol (black circles, n = 6) and the clinically manufactured sCAR-T cells (red triangles, n = 25). Bars are at the median value, and error bars represent interquartile range.

