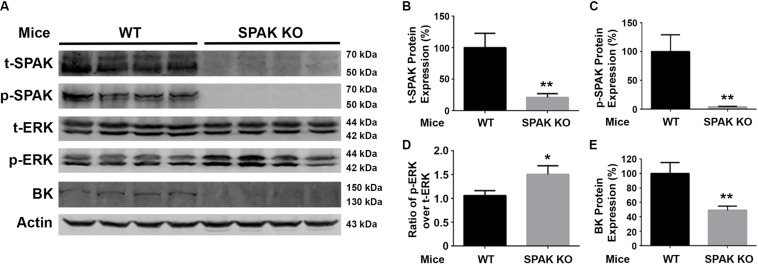
FIGURE 5.
BK protein abundance is significantly reduced while increasing ERK1/2 phosphorylation in SPAK KO mice. (A) Representative immunoblots are shown for BK, phosphorylated and total SPAK protein, phosphorylated and total ERK1/2 protein, and actin levels in both WT and SPAK KO mice. (B–E) Bar graphs represent the average band densities of t-SPAK, p-SPAK, ratio of p-ERK1/2 over t-ERK1/2, and BK. n = 4; *p < 0.05, **p < 0.01 compared with the WT mouse group.

