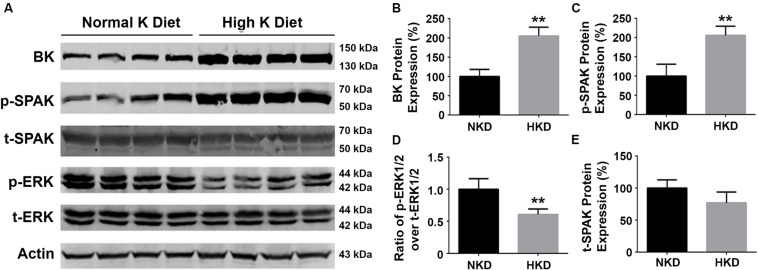
FIGURE 7.
The effects of high-potassium diet on protein levels of BK, SPAK phosphorylation, and ERK1/2 phosphorylation in WT mice. WT mice were fed with either normal K (NK, 1%) diets or high K (HK, 10%) diets for 10 days. The kidneys were then harvested for Western blot analysis. (A) Representative immunoblots are shown for BK, phosphorylated and total SPAK protein, phosphorylated and total ERK1/2 protein, and actin levels in both NK and HK mice groups. (B–E) Bar graphs represent the average band densities of BK, p-SPAK, t-SPAK, and the ratio of p-ERK1/2 over t-ERK1/2. Compared with the NK group, the BK protein abundance in the HK group was significantly increased. The phosphorylation level of SPAK was significantly increased in the HK group, and the phosphorylation level of ERK1/2 was significantly reduced compared to the NK group. n = 4; *p < 0.05, **p < 0.01.

