
FIGURE 4.
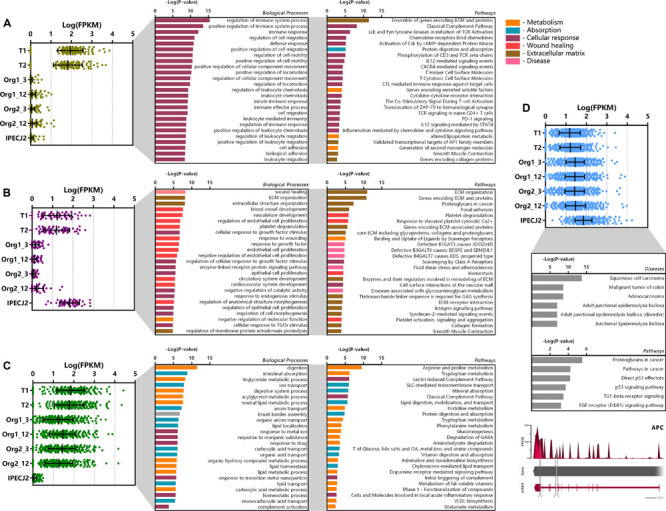
Cluster analysis of differentially expressed genes (DEGs). DEGs were clustered according to their expression pattern using k-means clustering, and subsequently analyzed for functional enrichment using TOPPfun. (A) Cluster of genes (n = 141) showing increased expression in tissue only and low expression in organoids and IPEC-J2. (B) Cluster of genes (n = 52) showing high expression in tissue and IPEC-J2, with low expression in organoids. (C) Cluster of genes (n = 299) with increased expression in tissue and organoids, with low expression in IPECJ-2 (data represented in Log(FPKM) or –Log(P-value), P and q < 0.05). (D) Cluster of genes (n = 841) expressed more highly in IPEC-J2 than tissue and organoids which were associated with diseases and pathways involved in tumor formation. A common mutation in colon cancer is inactivation of adenomatous polyposis coli (APC) gene where IPEC-J2 shows an insertion (217 bp, tandem duplication) in the protein coding region and splice site deletion (331 bp, cross mapped breakpoints; bottom).