
FIGURE 5.
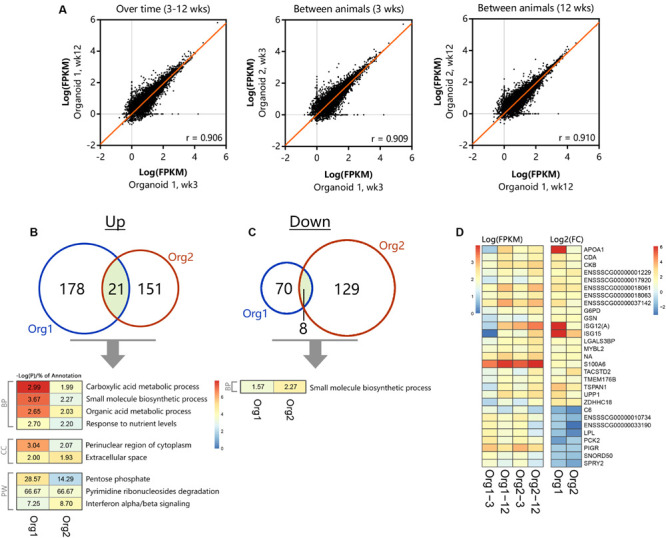
Differential gene- and pathway expression in organoids shows stable transcription over time. The two separate organoid cultures (n = 3 per group) were tested for expression differences between 3 and 12 weeks of culturing, (A) showing representative correlations over time within an organoid line and between different animals (n = 13813 genes with at least 1 sample >1 FPKM). Significant (p < 0.05) up- (B) and down-regulation (C) of genes and their corresponding overlapping pathways when tested individually using TOPPfun (overlapping area shows similar genes between organoid types, BP, Biological processes; CC, Cellular component; PW, Pathway). (D) Overlapping up- and down-regulated genes between 3 and 12 weeks of culturing in actual expression values [Log(FPKM)] and their corresponding fold change [Log2(FC)].