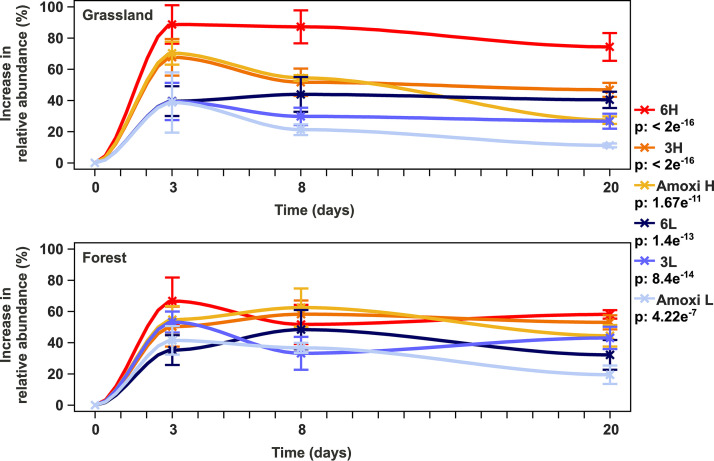
FIG 1.
Increase in relative abundance of “Ca. Udaeobacter” upon antibiotic treatment across grassland and forest soil microcosms. To determine the increase in “Ca. Udaeobacter” relative abundance, samples treated with antibiotics were compared with corresponding controls. The increase in abundance relative to these controls is depicted. The P values with respect to the increase in relative 16S rRNA gene abundance in grassland and forest soil microcosms in response to different antibiotic treatments over the whole course of the experiment are indicated in the key below the respective treatment designation. Precise information about the applied linear mixed model formulas and respective quality parameters are provided in Table S3 in the supplemental material. Standard errors are indicated by vertical bars. Amoxi L, treatment with amoxicillin in low concentration; 3L, treatment with three antibiotics in low concentrations; 6L, treatment with six antibiotics in low concentrations; Amoxi H, treatment with amoxicillin in high concentration; 3H, treatment with three antibiotics in high concentrations; 6H, treatment with six antibiotics in high concentrations. Bar plots depicting abundances of “Ca. Udaeobacter” relative to other bacterial groups with respect to the single samples analyzed in this study are presented in Fig. S1.

