FIG 3.
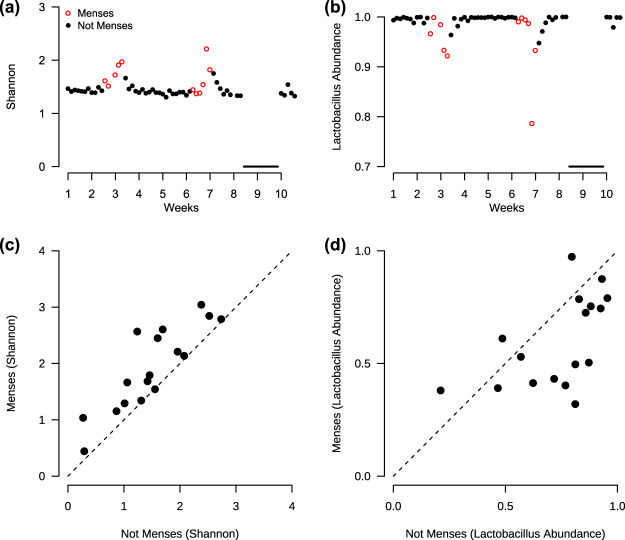
Diversity (Shannon index) increases and Lactobacillus decreases during menses. (a and b) Example of individual (participant 11) with increase in diversity (a) and decrease in Lactobacillus (b) during menses. Black line indicates the college’s spring break, when samples were not collected. (c) Across all participants (n = 17), the average diversity is greater during menses compared to not menses (Wilcoxon signed rank, P < 0.001). (d) The average Lactobacillus relative abundance is lower during menses compared to not menses (Wilcoxon signed rank, P = 0.01).

