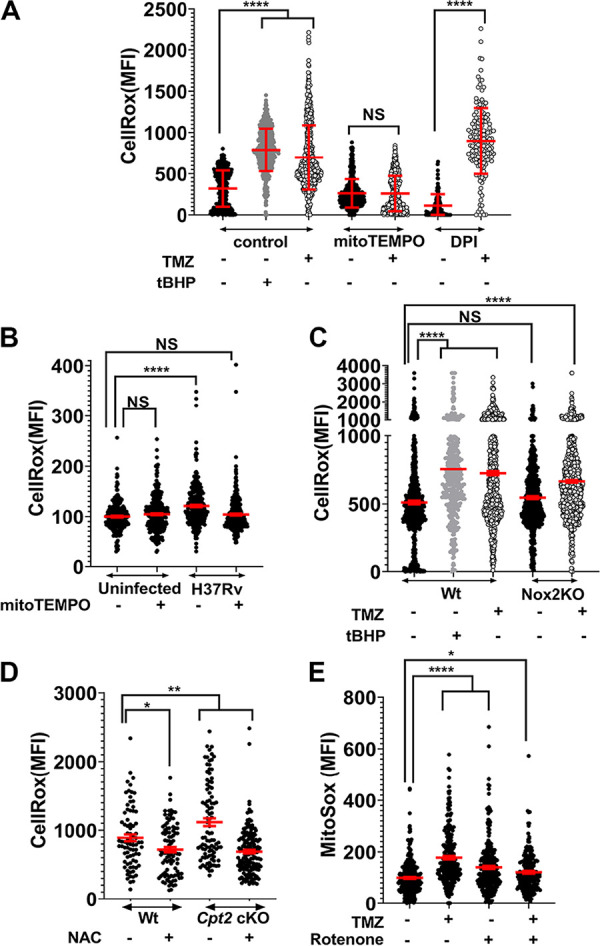
FIG 2.

FAO inhibition induces mitochondrial ROS. The CellRox mean fluorescence intensity (MFI) of BMDMs with various treatments is shown. (A) Uninfected iBMDMs that were untreated (-) or treated (+) with 500 nM TMZ for 3 h, alone or in the presence of mitoTEMPO (10 μM) or DPI (10 mM). (B) Uninfected and infected BMDMs with or without mitoTEMPO (10 μM) 4 hpi. (C) Mtb-infected Wt and Nox2 KO BMDMs that were untreated or treated with 5 nM TMZ for 3 h. (A and C) tert-Butyl hydroperoxide (tBHP; 0.25 mM, 30 min) was used as a positive control. (D) Mtb-infected Cpt2 cKO and control BMDMs 24 hpi that were untreated or treated with N-acetyl cysteine (NAC) (10 mM). (E) MitoSox MFI of uninfected BMDMs that were untreated or treated with 500 nM TMZ for 3 h, alone or in the presence of rotenone (10 μM, 30 min). Data show means ± standard deviations (SD) of duplicates (A) and means ± SEM (B to E) from at least two independent experiments where MFI was derived from more than 100 individual cells. *, P = 0.02; **, P = 0.001; ****, P ≤ 0.0001; NS, not significant, calculated using unpaired Student’s t test with Welch’s correction (A) and ordinary one-way ANOVA (B to E). For panels B and E, values are expressed as percentage of the value for the uninfected, untreated cells. See also Fig. S3 and S4.
