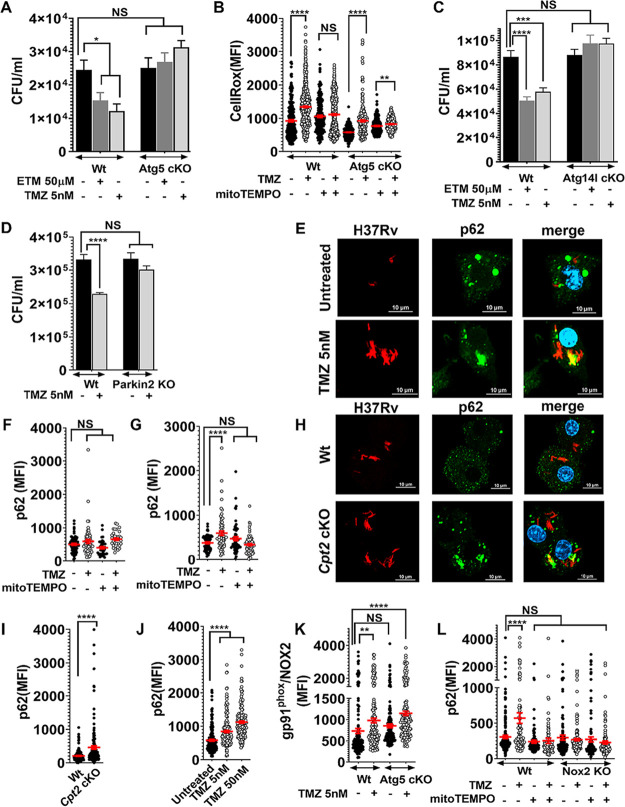
FIG 4.
Antimicrobial activity of FAO inhibitors depends on autophagy. (A) Survival of Mtb was compared in FAO inhibitor-treated control and Atg5 cKO macrophages, 72 hpi. Data show means ± SEM with *, P ≤ 0.03 calculated using one-way ANOVA. (B) CellRox MFI in Mtb-infected control and Atg5 cKO BMDMs after TMZ treatment (5 nM, 3 h), with or without mitoTEMPO. **, P = 0.002; ****, P ≤ 0.0001 by unpaired Student's t test with Welch’s correction. (C and D) Survival of Mtb in BMDMs from control and Atg14l cKO cells 72 hpi (C) and Parkin2 KO cells 120 hpi. (D) Data show means ± SEM. ***, P = 0.0002; ****, P ≤ 0.0001 using ordinary one-way ANOVA in panels C and D. (E) IF microscopy of p62 (green) and dsRed-expressing H37Rv (red) in BMDMs treated with 5 nM TMZ 24 hpi. The colocalized region is shown in yellow. Bars = 10 μm. (F and G) MFI of p62 colocalized with Mtb was measured in BMDMs treated with 5 nM TMZ alone or with mitoTEMPO for 3 h (F) or 24 h (G). ****, P ≤ 0.0001 by ordinary one-way ANOVA. (H and I) IF images (H) and MFI (I) of p62 colocalized with Mtb in Cpt2 KO and control BMDMs 24 hpi. (J) MFI of p62 colocalized with ΔesxA mutant in BMDMs treated with TMZ for 24h. (K) MFI of gp91phox/NOX2 colocalized with Mtb in control versus Atg5 cKO BMDMs after TMZ treatment (5 nM, 24 hpi). (L) MFI of p62 colocalized with Mtb in control and Nox2KO macrophages treated with 5 nM TMZ with or without mitoTEMPO, 24 hpi. Data show means ± SEM.**, P = 0.001; ****, P ≤ 0.0001 calculated using unpaired Student’s t test with Welch’s correction in panel K and ordinary one-way ANOVA for panels J and L. All panels show data from one representative experiment from at least two independent replicates. See also Fig. S3.

