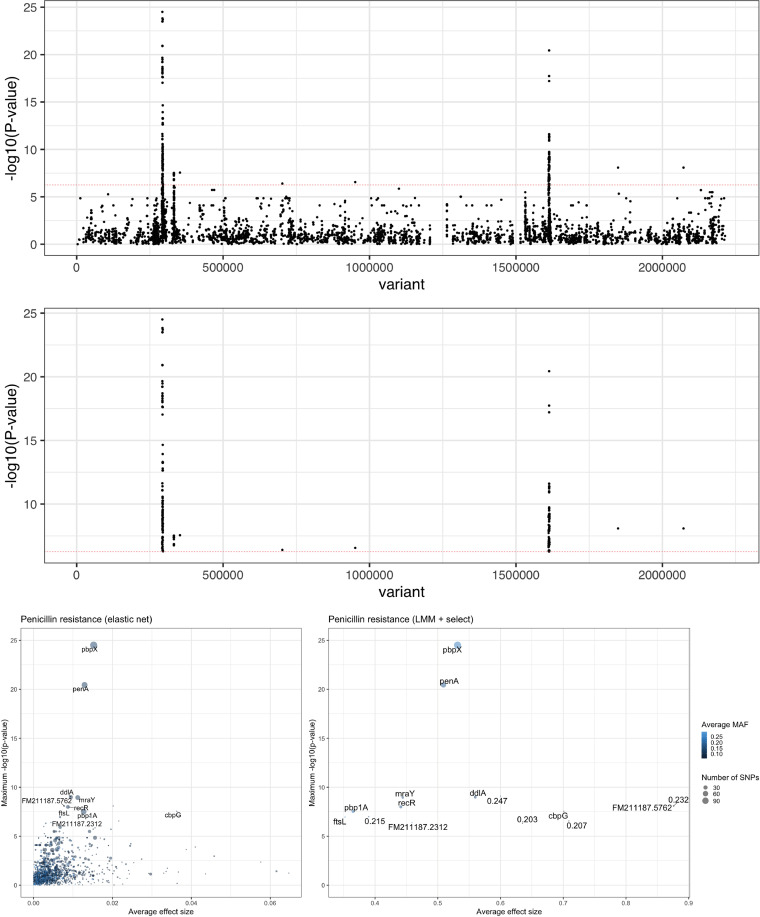
FIG 3.
Elastic net and linear mixed model with SNP-based penicillin resistance. (Top) Manhattan plot of the selected elastic net variants, with a Bonferroni-adjusted significance threshold in red. The three biggest peaks are in the causal pbp genes. (Middle) The same result with the LMM, taking only those SNPs above the significance threshold. (Bottom) Summary of the genes selected by both methods (left, elastic net; right, LMM), maximum P value, and average absolute effect size within each gene.

