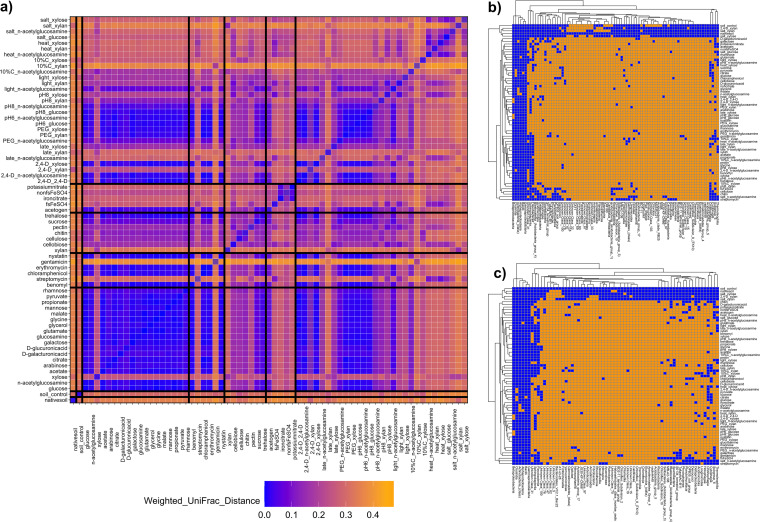
FIG 1.
Distance between functional module communities and presence/absence heatmaps. (a) Heatmap of the mean pairwise weighted UniFrac distance between all sample replicates for one functional module and all replicates for another module. Each box represents the average across all replicates for the module. Shades of orange and blue represent high and low average weighted UniFrac distances, respectively. Black lines between samples represent the demarcation between functional module categories (i.e., “soil,” “simple substrates,” “antibiotics,” “polysaccharides,” “anaerobic,” and “stresses”). (b and c) Heatmaps representing how functional modules captured soil taxa at the class level. The x axes represent all classes that had nonzero counts in either liquid soil extract control (b) or native soil control (c); the y axes represent all functional modules, grouped by hierarchical clustering. Orange squares are for modules by class combinations that have no counts for the corresponding class in any module replicate; blue squares represent module by class combinations that have at least one count in at least one module replicate.

