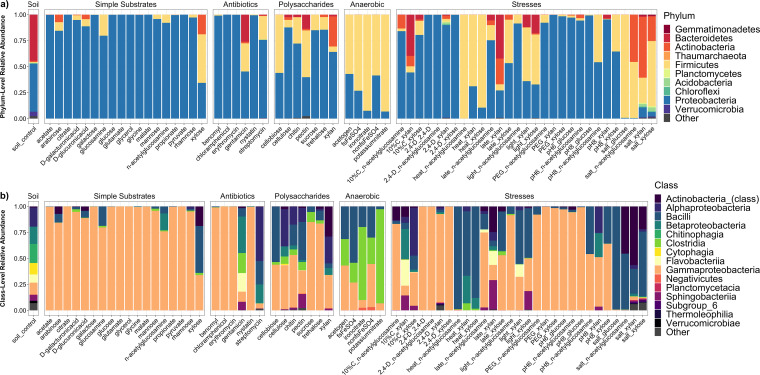
FIG 3.
Community trends for full data set, phylum level and class level. (a and b) Relative abundance plots for all modules encompassing either the top 10 most abundant phyla (a) or the top 15 most abundant classes (b). Modules are grouped by the overlying module category (soil, simple substrates, antibiotics, anaerobic, or stresses). Plots represent the average of all replicates for each given module. “Soil” refers to liquid soil extract control.

