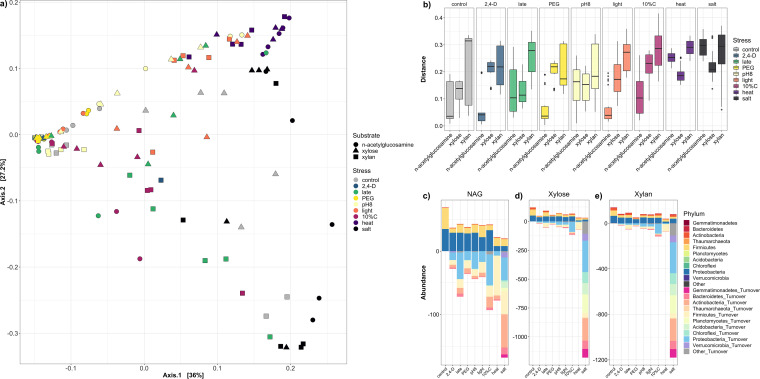
FIG 4.
Stress dataset of weighted UniFrac distance and nestedness/turnover trends. (a) Principal coordinate analysis of weighted UniFrac Distance for samples within the “stress” subset. Substrate is delineated by shape: ●, N-acetylglucosamine; ▲, xylose; and ■, xylan. Colors indicate the specific stress imposed (gray, control; blue, 2,4-D; green, late harvesting; yellow, PEG [osmotic stress]; light yellow, pH 8; orange, constant light; magenta, 10%C [dilute carbon]; purple, heat stress; and black, salt stress). (b) Boxplots representing the weighted UniFrac distances for all replicates for a stress module from its unstressed control of the same substrate, segregated into stress × substrate combinations. Control boxplots (gray) indicate distances for control replicates from one another. (c, d, and e) Nestedness and turnover plots for stress modules, segregated by substrate (for N-acetylglucosamine or NAG [c], for xylose [d], and for xylan [e]). Above the x axis at 0 represents nestedness, or the distinct OTUs present in the control unstressed module that were also found in the stress modules for the same substrate. Below the x axis at 0 represents turnover, or the distinct OTUs uniquely found in stress modules not present in their respective unstressed control. Bars are colored by which parent phylum to which the OTUs belong.

