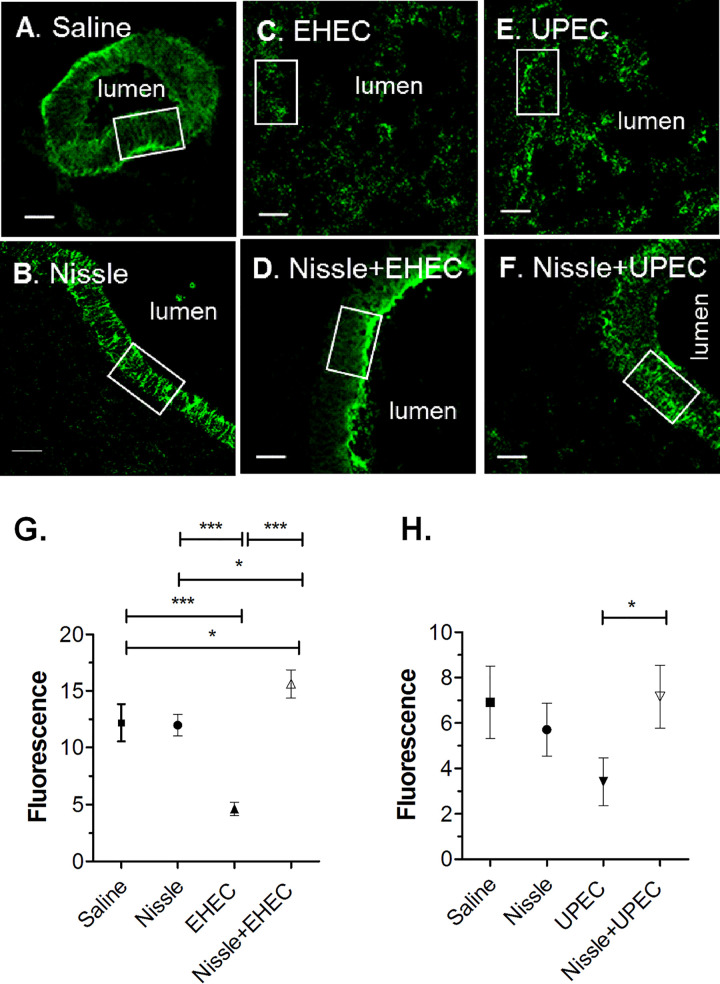
FIG 7.
E-cadherin expression. Cryosections from saline-injected controls, single-strain infections, and coinfection experiments (as described in Fig. 4 and 5) were stained for E-cadherin. A white box was sized to outline the epithelial cells stained for E-cadherin in the control HIOs. Keeping the boxed area constant, fluorescence was quantified for three random epithelial areas for each organoid, and the results were averaged. Statistical analysis was performed using the averages for the three independent repeats (n = 3). (A) Saline, 72 h postinjection; (B) Nissle, 72 h postinjection; (C) EHEC, 18 h postinjection; (D) Nissle and EHEC, coinfection at 18 h; (E) UPEC, 72 h postinjection; (F) Nissle and UPEC, coinfection at 72 h. White boxes indicate the regions used to quantify fluorescence. Bars, 20 μm. (G and H) Fluorescence was quantified using ImageJ software and plotted as the mean ± SD (n = 3). (G) E-cadherin fluorescence in the EHEC challenge; (H) E-cadherin fluorescence in the UPEC challenge. Statistical significance was assessed with GraphPad Prism (version 5) software, using one-way analysis of variance with Bonferroni’s posttest. *, P = 0.1 to 0.01; ***, P < 0.0001.

