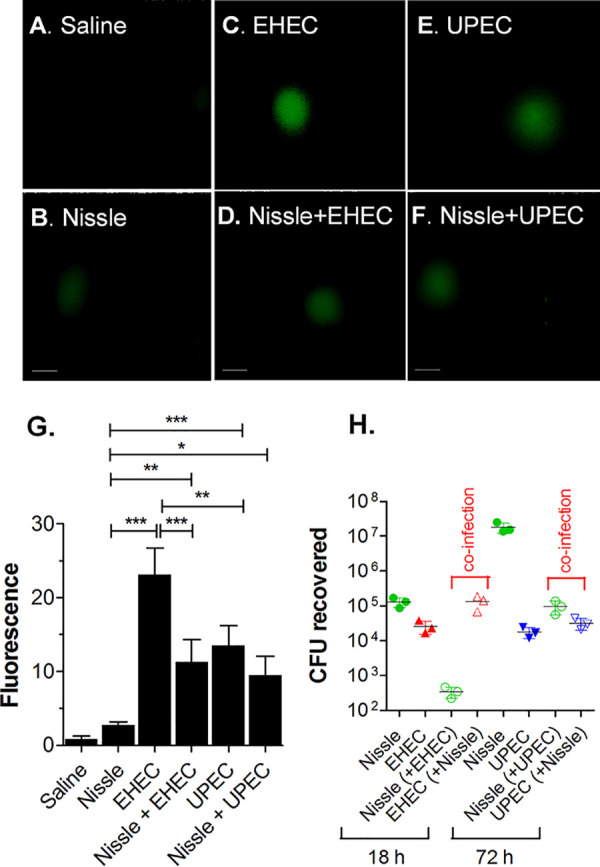
FIG 9.

Nissle influences ROS production. HIOs were microinjected with saline; 103 CFU of Nissle, EHEC alone, or UPEC alone; or coinfected, as described in Fig. 4 and 5. (A to F) HIOs were injected with an ROS detection reagent, and ROS fluorescence was measured. (A) Saline, 72 h postinjection; (B) Nissle, 72 h postinjection; (C) EHEC, 18 h postinjection; (D) Nissle and EHEC, coinfection at 18 h; (E) UPEC, 72 h postinjection; (F) Nissle and UPEC, coinfection at 72 h. Bars, 50 μm. (G) Fluorescence intensity was quantified using ImageJ software and plotted as the mean ± SD (n = 3). Statistical significance was assessed with GraphPad Prism (version 5) software, using one-way analysis of variance with Bonferroni’s posttest. *, P = 0.1 to 0.01; **, P = 0.001 to 0.01; ***, P < 0.0001. (H) The number of CFU recovered was determined at the indicated time points (n = 3).
