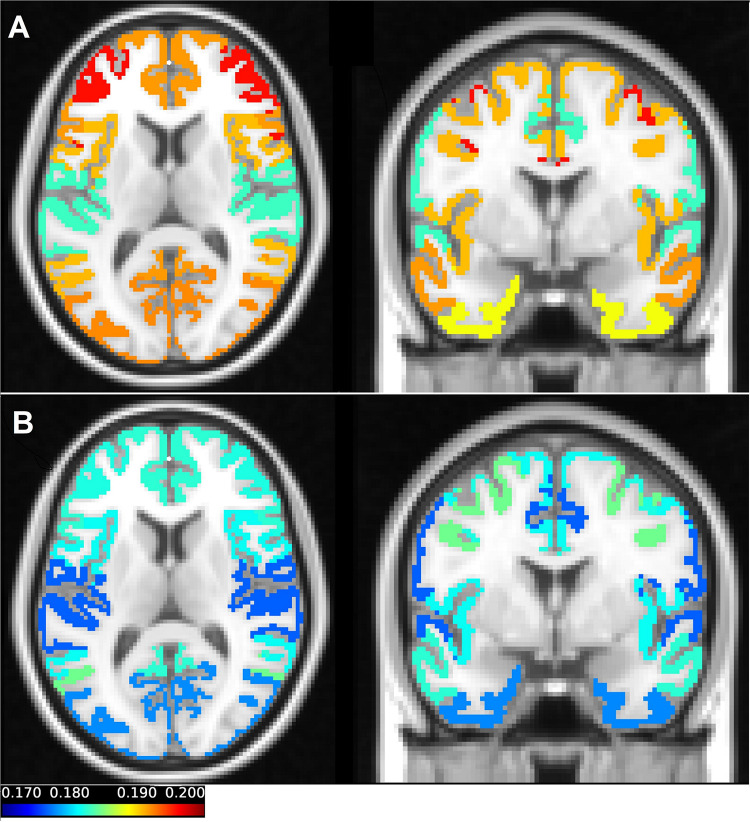
FIGURE 1.
The average entropy values across scans of each of the seven networks in resting state (A) and during a working memory task (B) were mapped on the T1-weighted image. The coronal and axial views were selected in a way that all parcellations can be presented in one figure. In (A) the axial view clearly demonstrates the frontoparietal network, which has the highest value of the entropy during resting state. The somatomotor and limbic networks have low values of the entropy in the resting state. In (B) the dorsal attention network which has the highest entropy during the working memory task can be seen both in the coronal and axial view. Also, in (B) the visual and limbic networks are presented, which have the lowest values of entropy in task.

