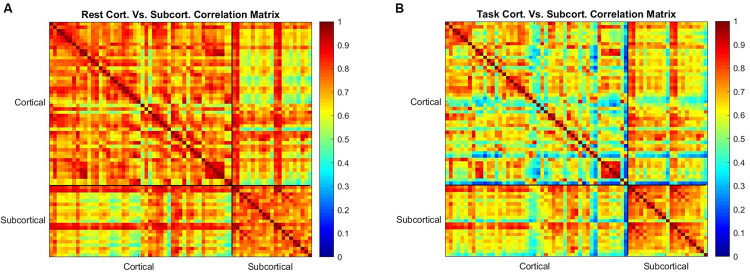
FIGURE 5.
The correlation between the mean value of sample entropy for 42 cortical and 21 subcortical regions of interest as a measure of similarity in rest is shown in (A,B) shows the correlation between the same regions during the working memory task. Correlation is generally reduced during task performance, but the subcortical regions are less affected than the cortical regions.

