Figure 5.

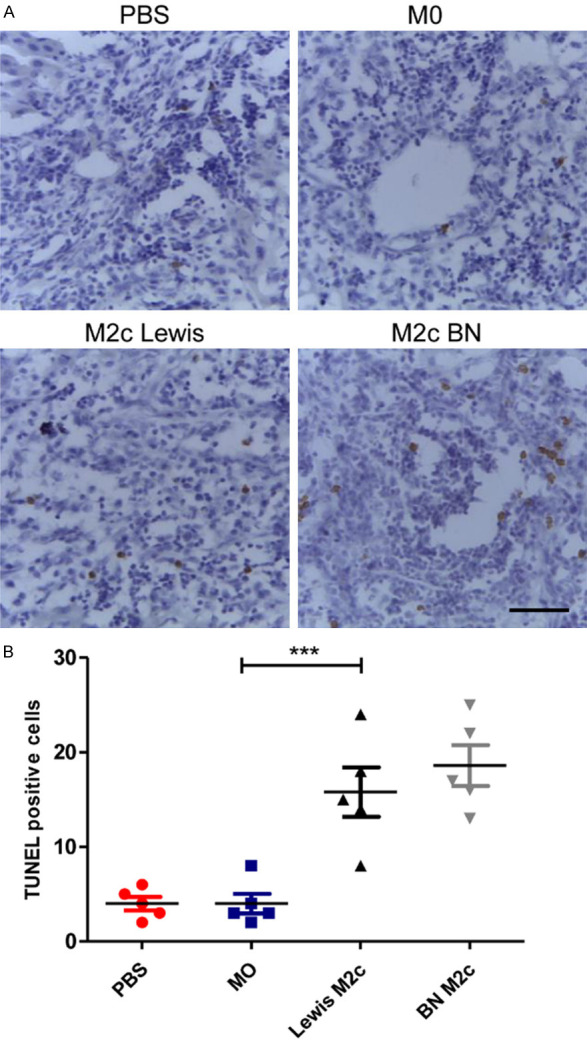
The M2c BMDMs promote apoptosis of lymphocytes. A. Representative images of TUNEL staining of liver allografts in four groups 7 days following transplantation with original magnifications of ×400. TUNEL positive cells are in brown color. Scale bar in right lower corner represents 25 µm. B. The numbers of the apoptic cells in recipients with the transfusion of the M2c macrophages were significantly increased compared with the recipients received the M0 macrophages. Statistical analysis was performed by one-way ANOVA, followed by post hoc test of Tukey’s (n = 5 for each group). Data are presented as the mean ± SD. ***P < 0.001 vs M0 group.
