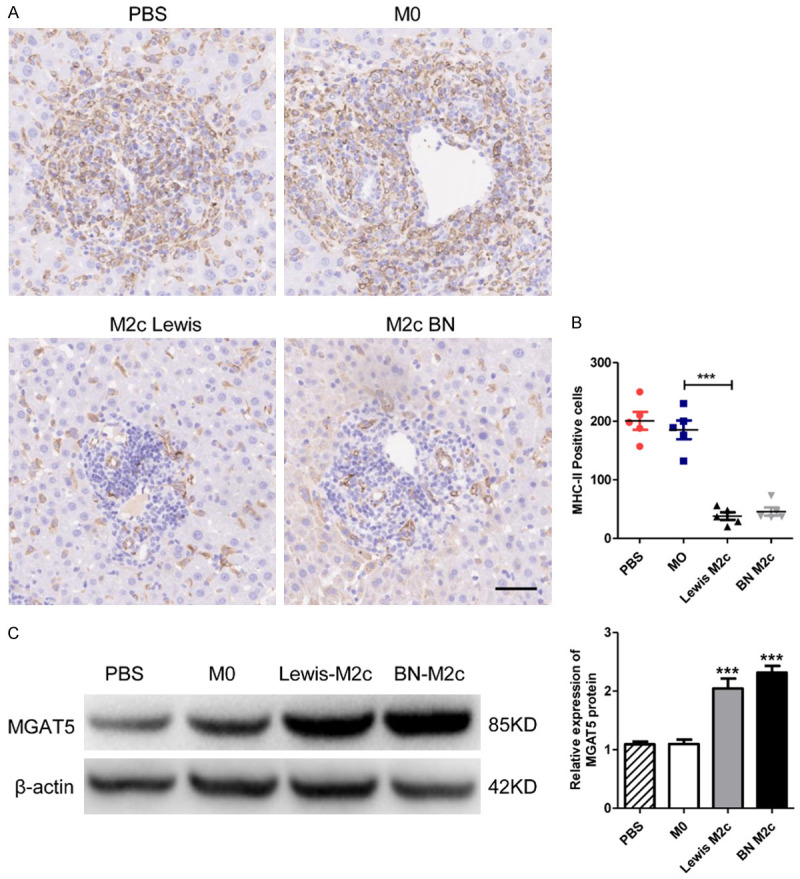
Figure 6.

The expression of MHC-II and MGAT5 in liver grafts. (A) Representative images of IHC staining of MHC-II positive cells in liver grafts 7 days following liver transplantation with original magnifications of ×200. The MHC-II positive cells are in brown color. Scale bar in right lower corner represents 50 µm. (B) The numbers of the MHC-II positive cells in (A) were counted and quantitatively compared. MHC-II positive cells significantly reduced in the M2c infusion groups. No significant differences were observed between the M0 and the PBS group. Data were analyzed by one-way ANOVA, followed by post hoc test of Tukey’s (n = 5 for each group). Data are presented as the mean ± SD. ***P < 0.001 vs M0 group. (C) MGAT5 and β-actin protein expression in liver grafts were detected by western blot analysis. The expression of MGAT5 was significantly upregulated in the M2c infusion groups. No significant differences were observed between the M0 and the PBS group. Data are presented as means ± SD. ***P < 0.001.
