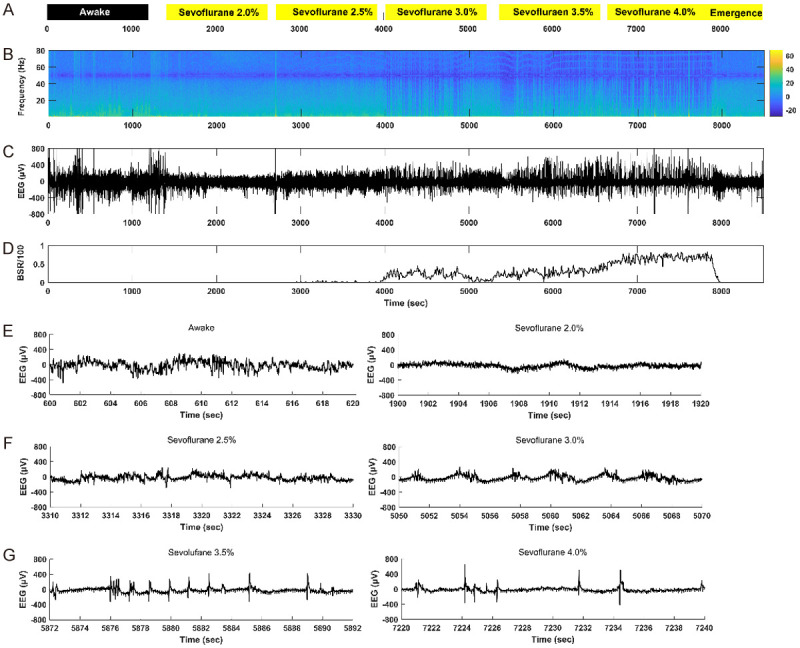
Figure 3.

Representative electroencephalogram (EEG) power spectrogram, burst-suppression ratio (BSR) and raw EEG traces in an NL mouse. (A), the concentration and duration of sevoflurane anesthesia; black box indicates dark condition, yellow boxes indicate light conditions. (B), EEG power spectrogram. Color bar, scale in decibels (dB); warm colors indicate frequency components with high power; cool colors indicate frequency components with low power. The EEG energy is decreased with the increase of the sevoflurane concentration. The deeper the anesthesia, the lower the EEG energy. (C), raw EEG trace under sevoflurane anesthesia. (D), BSR response under sevoflurane anesthesia. The BSR is increased with the increase of the sevoflurane concentration. (E-G), representative raw EEG traces (20 s) in the waking state (E left) and under 2.0% sevoflurane (E right), 2.5% sevoflurane (F left), 3.0% sevoflurane (F right), 3.5% sevoflurane (G left), 4.0% sevoflurane (G right).
