
Figure 4.
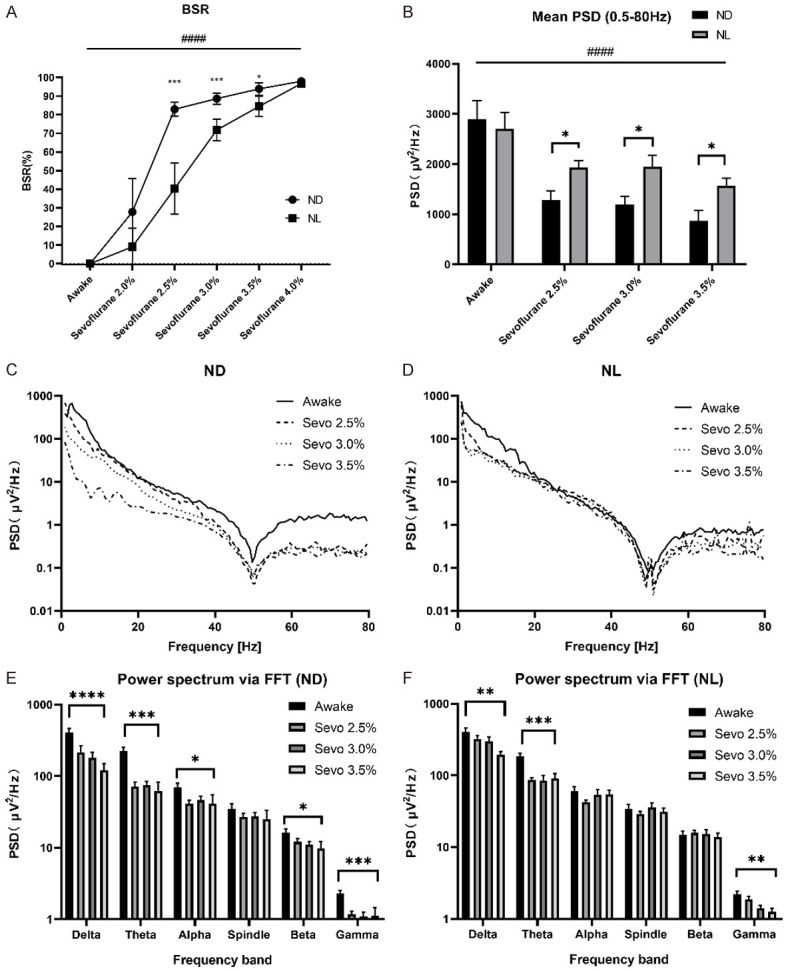
Effect of acute continuous nocturnal light exposure (ACNLE) on electroencephalogram (EEG) burst-suppression ratio (BSR) and EEG power spectral density (PSD) under sevoflurane anesthesia. (A), BSR for sevoflurane at each state. BSR increased as the sevoflurane concentration increased in groups ND and NL (####P < 0.0001, main effect of sevoflurane concentration by two-way rANOVA). Compared to group ND, acute light exposure in group NL caused a significant decrease in BSR at 2.5%, 3.0% and 3.5% sevoflurane. With the lowest (2.0%) and highest (4.0%) concentrations of sevoflurane, there were no significant differences in BSR between groups NL and ND (*P < 0.05, ***P < 0.001 compared with ND, n = 10 in each group, two-way rANOVA followed by Sidak’s multiple comparison test). (B), mean EEG PSD over the whole frequency band (0.5-80 Hz) from quantitative EEG spectral analysis in the waking state and under 2.5%, 3.0% and 3.5% sevoflurane anesthesia for groups NL and ND. The mean EEG power decreased as the sevoflurane concentration increased in groups ND and NL (####P < 0.0001, main effect of sevoflurane concentration by two-way rANOVA). The mean EEG power over the whole frequency band (0.5-80 Hz) was increased in group NL compared to group ND at 2.5%, 3.0% and 3.5% sevoflurane (*P < 0.05 compared with ND, n = 10 in each group, two-way rANOVA followed by Fisher’s LSD test). (C and D), for normalization, the squared magnitude of the fast Fourier transform (FFT) was divided by the number of samples (N) and by the sampling frequency (Fs). Average periodograms from four representative EEG recordings (4 s sweeps, 5-taper FFT, total trace length 300 s) obtained as above for ND (C) and NL (D). (E and F); mean EEG power from quantitative spectral analysis for ND (E) and NL (F) in single frequency bands under sevoflurane in each state. Group ND produced a significant reduction in EEG power in almost all individual frequency bands, with the exception of the spindle band. However, Group NL produced a significant reduction in EEG power only in the delta, theta and gamma bands (*P < 0.05, **P < 0.01, ***P < 0.001, ****P < 0.0001, n = 10 in each group, main effect of sevoflurane concentration by one-way rANOVA). Sevo = sevoflurane. ND, nighttime administration of sevoflurane (20:00-24:00) in the dark; NL, nighttime administration of sevoflurane (20:00-24:00) with exposure to light.