
Figure 2.
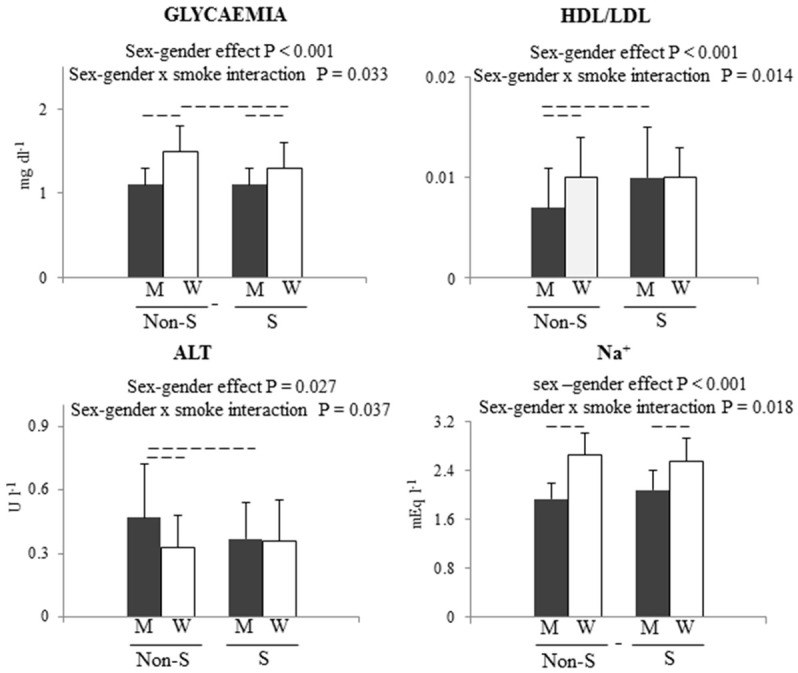
Sex-gender x smoking interactions after normalization for body weight. P values are reported for main effect and for interaction. Dashed lines represent a P < 0.05 for multiple comparison test. W = women, M = men, S = smokers, Non S = non smokers.