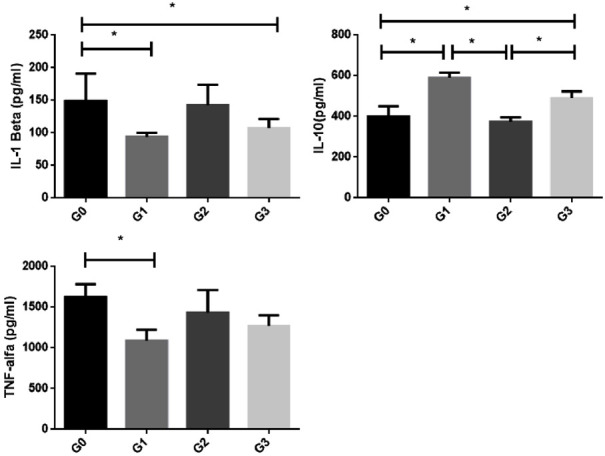
Figure 7.

Levels of IL-1β, IL-10 and TNF-α in (*P<0.05): G0 group: positive control (with defect and no treatment); G1 Group: hydroxyapatite-treated group; G2 Group: Zirconia-treated group; G3 Group: 80/20 zirconia/hydroxyapatite blend treated group (ANOVA test followed by Bonferroni), (*P<0.05), (***P<0.001), (**P<0.01).
