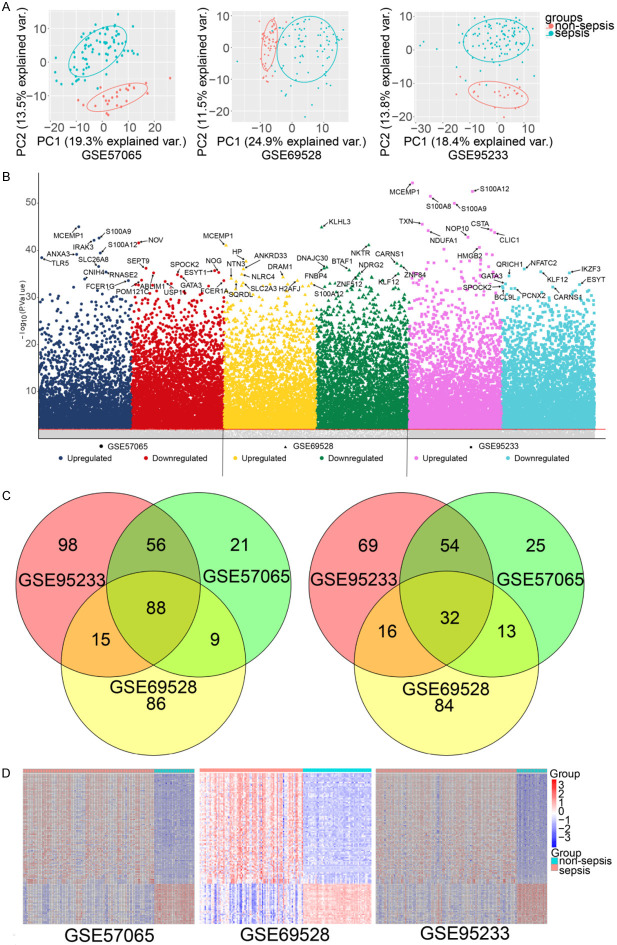
Figure 2.
Differentially expressed genes in sepsis compared to non-sepsis. A. Principal component analysis of sepsis vs. non-sepsis. B. Manhattan plot of differentially expressed genes in sepsis and non-sepsis. The top ten upregulated and downregulated genes with the highest significance (ranked by P value) are highlighted. Gray represents genes that are not significantly differentially expressed. C. Venn diagram showing upregulated genes and downregulated genes. D. Expression heatmap of upregulated and downregulated genes common to the three data sets.

