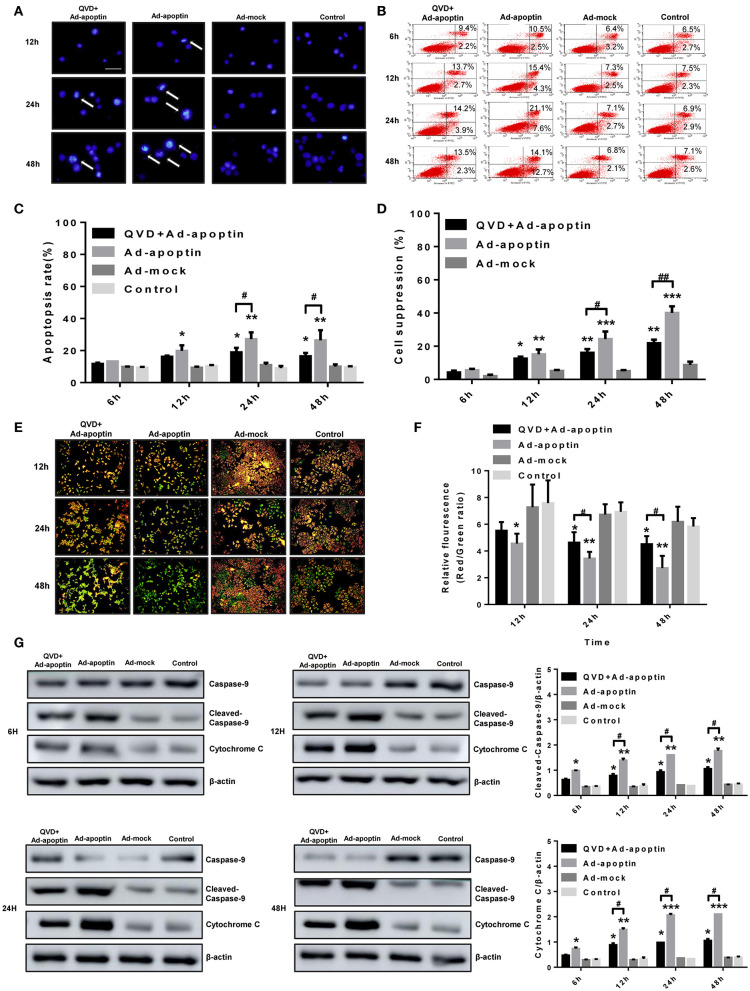
Figure 2.
Characterization of cell death pathway induced by apoptin in SMMC-7721 cells. (A) Morphological changes were visualized by fluorescence microscopy after hoechst staining. SMMC-7721 cells were infected with Ad-apoptin or Ad-mock, then stained with Hoechst stain at 12, 24, and 48 h. Nuclear thickening and nuclear fragmentation of Ad-apoptin group increased significantly over time. (B,C) SMMC-7721 cells apoptosis were analyzed by flow cytometry after Annexin-V FITC/PI staining. The apoptosis level of SMMC-7721 cells infected with Ad-apoptin was significantly higher than that of other groups; the addition of QVD will cause a significant decrease in the apoptosis level of SMMC-7721 cells infected with Ad-apoptin. (D) After the addition of the apoptosis inhibitor QVD to the cells infected with Ad-apoptin, the growth inhibition rate mediated by apoptin was significantly reduced. (E,F) Changes in red and green fluorescence, measured by fluorescence microscopy after JC-1 staining. Increased apoptosis results in a decrease in the ratio of red to green fluorescence. Quantitative measurement of changes in the ratio of red to green fluorescence after JC-1 staining. Ad-apoptin clearly altered the mitochondrial membrane potential (MMP), and Ad-apoptin had the strongest ability to induce apoptosis by affecting the MMP. (G) Western blotting analysis of caspase-9 and cytochrome C protein expression at different time points on SMMC-7721 cells. The cleaved-caspase-9 and cytochrome C protein level of Ad-apoptin group was higher than Ad-MOCK and control group; after adding QVD, the expression levels of the two proteins were significantly reduced. The scale bar equals 100 μm. Data are presented as mean ± SD (*p < 0.05, **p < 0.01, ***p < 0.001) when compared with Ad-mock or controls. Data are presented as the mean ± SD (#p < 0.05, ##p < 0.01) when compared with Ad-apoptin.

