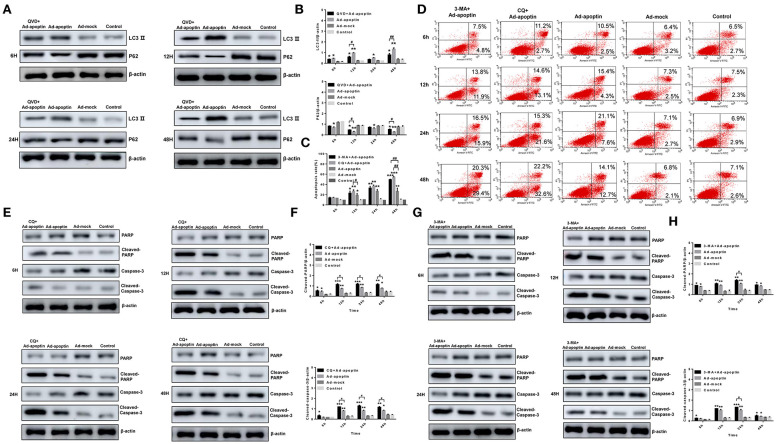
Figure 4.
Identification of the relationship between autophagy and apoptosis on apoptin-induced SMMC-7721 cells. (A,B) Western blotting analysis of LC3-II and P62 in SMMC-7721 cell extracts. The LC3-IIprotein level of Ad-apoptin group was higher than Ad-MOCK and control group. In contrast, the P62 protein level of Ad-apoptin group was higher than Ad-MOCK and control group. Inhibition of apoptosis in apoptin-treated liver cancer cells can significantly reduce autophagy levels and the difference is most obvious at 12 and 48 h. (C,D) Apoptosis analysis by flow cytometry after Annexin-V FITC/PI staining. The apoptosis level of SMMC-7721 cells infected with Ad-apoptin was significantly higher than that of other groups; the addition of 3-MA and CQ will cause a significant increase in the apoptosis level of SMMC-7721 cells infected with Ad-apoptin. (E,F) Western blotting analysis of cleaved-PARP and cleaved-Caspase-3 in SMMC-7721 cell extracts. The cleaved-PARP and cleaved-Caspase-3 protein level of Ad-apoptin group was higher than Ad-MOCK and control group; the addition of CQ will cause a significant increase in the expression level of cleaved-PARP and cleaved-Caspase-3 and the difference is most obvious from 12 h. (G,H) The addition of 3-MA will cause a significant increase in the expression level of cleaved-PARP and cleaved-Caspase-3 and the difference is most obvious at 24 h. Data are shown as mean ± SD (*p < 0.05, **p < 0.01, ***p < 0.001) when compared with controls. Data are shown as mean ± SD (#p < 0.05, ##p < 0.01) when compared with Ad-apoptin.

