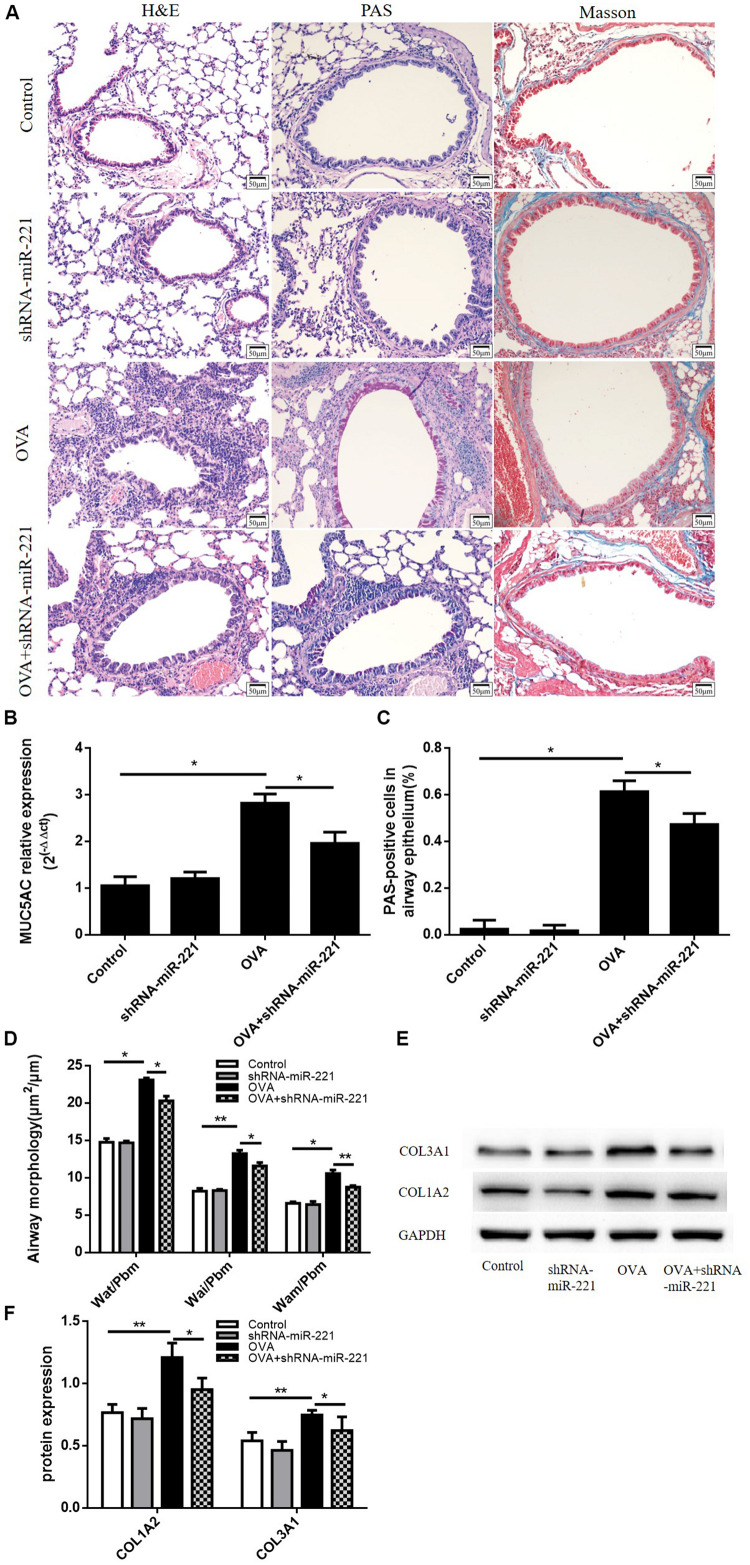
FIGURE 3.
Representative lung sections from different staining methods and the expression levels of ECM proteins in the lung. (A) Hematoxylin and eosin (H&E) staining showing the infiltration of inflammatory cells, Periodic acid–Schiff (PAS) staining showing mucus cells (purple stain), Masson trichrome staining showing subepithelial collagen deposition (blue stain). (B) The mRNA expression of MUC5AC in lung tissue. (C) The percentage of PAS-positive epithelial cells. (D) Airway wall thickness was analyzed by HE-stained lung sections. Magnification, 200X; animal groups (in all panels): n = 6. *p < 0.05, **p < 0.01. (E,F) Representative western blots show the levels of type I collagen and type III collagen in the lungs. GAPDH was used as a loading control. Data are means ± SD from three experiments. *p < 0.05, **p < 0.01.

