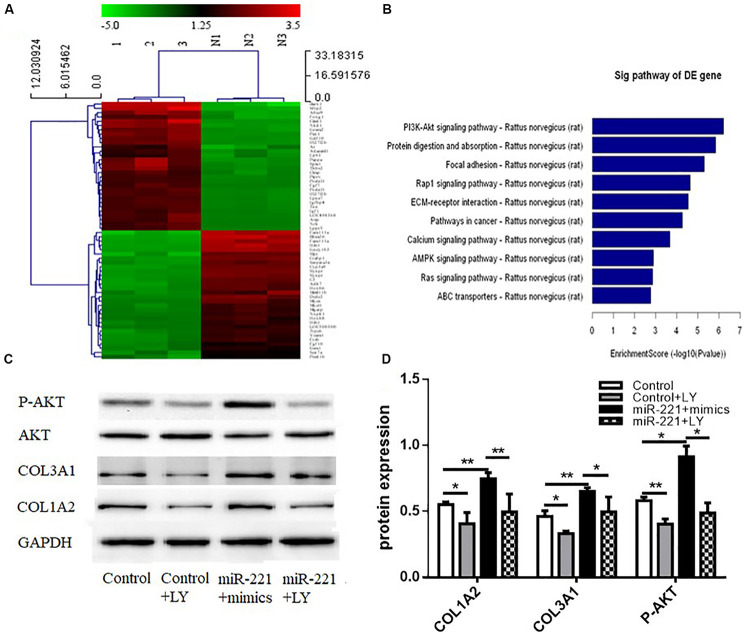
FIGURE 5.
The activity of the PI3K/AKT signaling pathway in response to miR-221 upregulation. (A) The heat map of differential gene expression in different groups. (B) The changes in the signaling pathway. (C,D) The level of protein expression. Data were normalized to GAPDH expression and are presented as expression relative to controls. Data are means ± SD from three experiments. *p < 0.05, **p < 0.01.

