Figure 4.
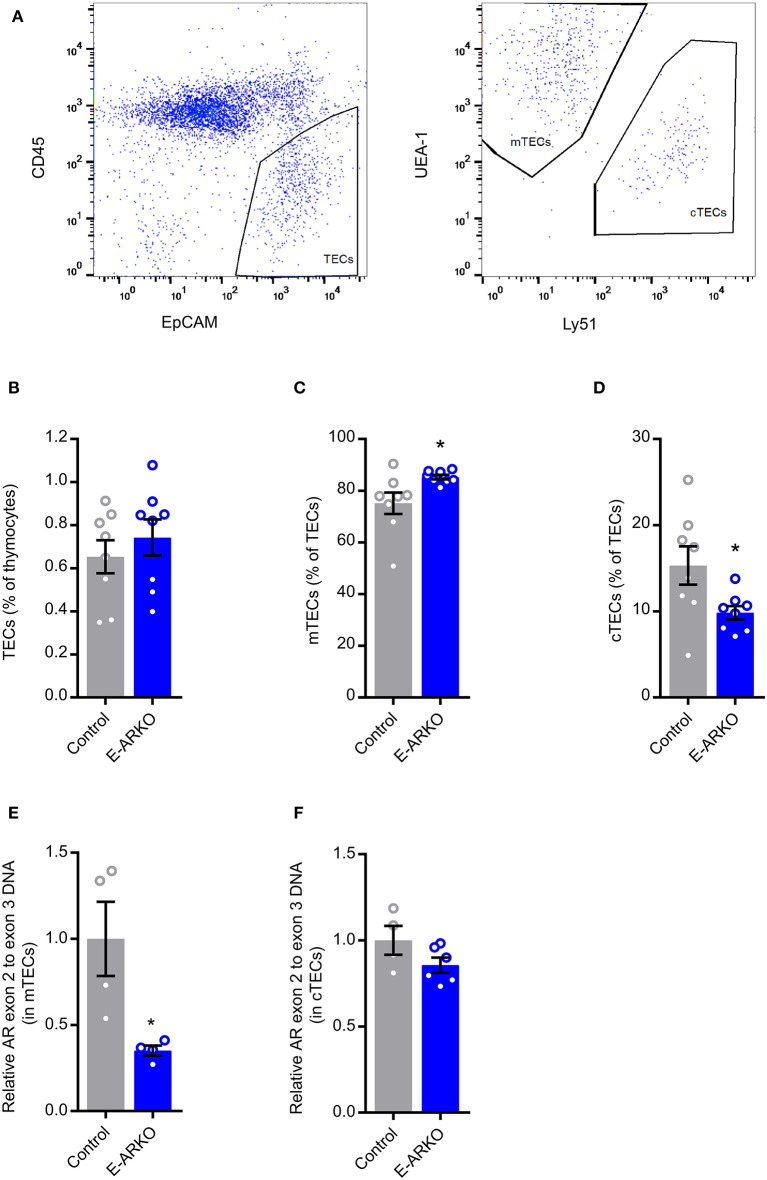
TEC shift in E-ARKO mice. (A) Gating strategy for TECs. (B–D) Relative numbers of all thymic epithelial cells (TECs), cortical (cTEC; CD45− EpCAM+ UEA1− Ly51+), and medullary (mTEC; CD45− EpCAM+ UEA1+ Ly51−) TEC in control and E-ARKO male mice; n = 8/group. (E) Assessment of AR knockout by measurement of exon 2 gDNA in mTECs from 4-week-old control (K5-Cre+; n = 4) and E-ARKO (ARflK5-Cre+; n = 4) male mice. (F) Assessment of AR knockout by measurement of exon 2 gDNA in cTECs from 8-week-old control (K5-Cre+; n = 4 pools, 2 mice/pool) and E-ARKO (ARflK5-Cre+; n = 6 pools, 2 mice/pool) male mice. *P < 0.05 (Mann-Whitney U test); all bars indicate means; circles represent individual mice, error bars indicate SEM.

