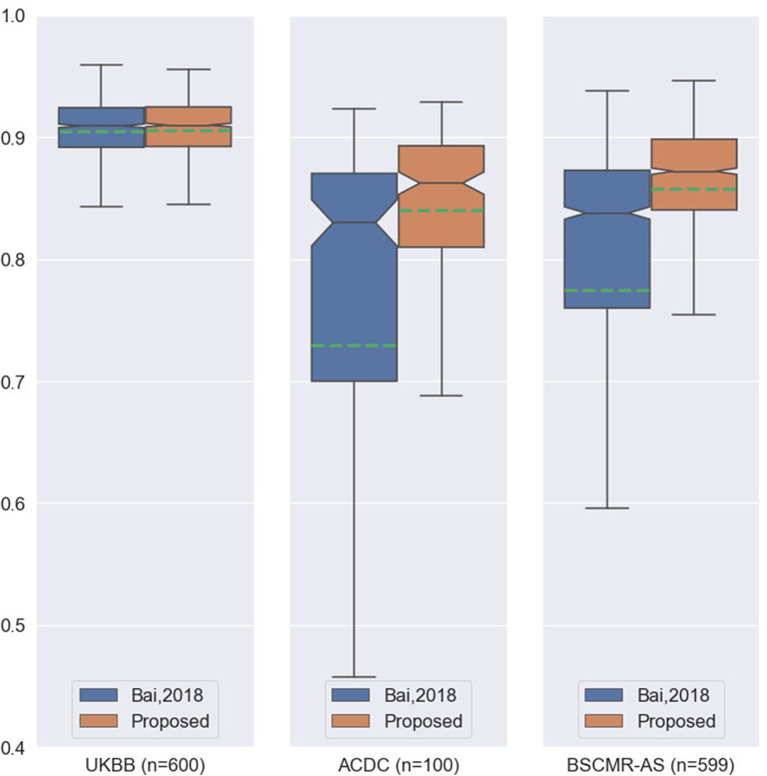
Figure 2.
Boxplots of the average Dice scores between the results of our previous work (3) and the results of the proposed method on the three datasets. For simplicity, we calculate the average Dice score over the three structures (LV, MYO, RV) for each image in the three datasets. The boxplots in orange are the results of the proposed method whereas the boxplots in blue are the results of the previous work. The green dashed line in each boxplot shows the mean value of the Dice scores for the segmentation results on one dataset.

