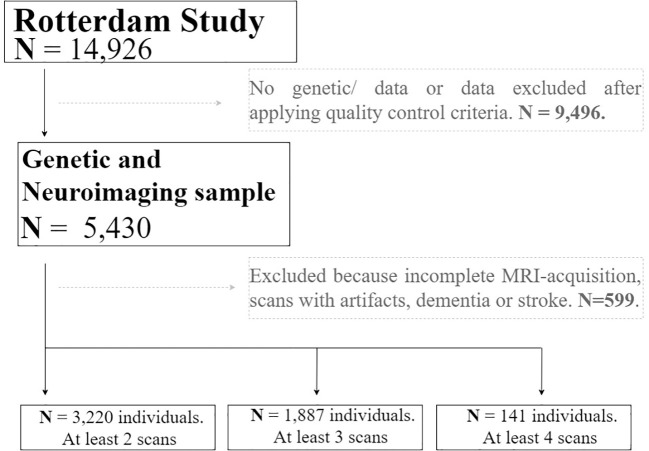
Figure 1.
Flow chart depicting the final sample size of the real application. Solid lines and boxes represent individuals remaining in the study. Dashed lines and boxes represent individuals excluded. Reason and number of individuals excluded is indicated in dashed boxes. Legend: N, size of the sample.

