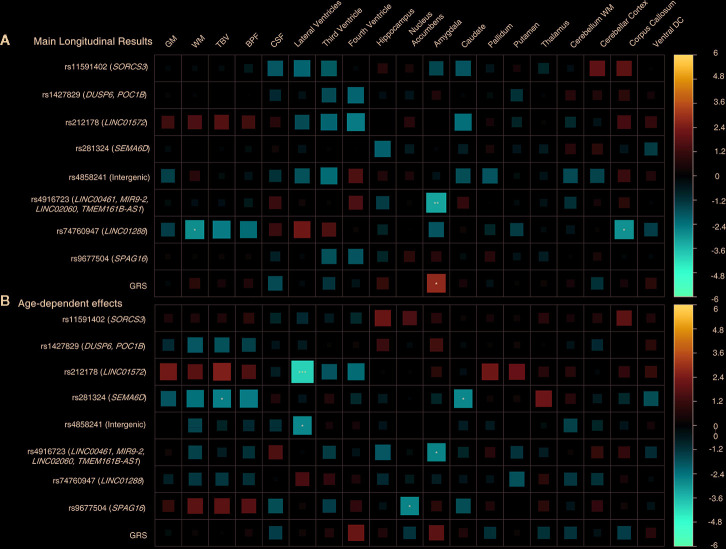
Figure 4.
Longitudinal design, subset of individuals older than 70 years. (A) Main results. (B) Age-by-SNP results. ***Pvalue = 0.0002 (Bonferroni correction); **Pvalue = 0.003 (BH correction); *Pvalue = 0.05 (nominal p-value). Color scale represents the normalized effect sizes. Legend: GM, Grey Matter; WM, White Matter; TBV, Total Brain Volume; BPF, Brain Parenchymal Fraction; CSF, Cerebrospinal Fluid; DC, Diencephalon; GRS, Genetic Risk Score.

