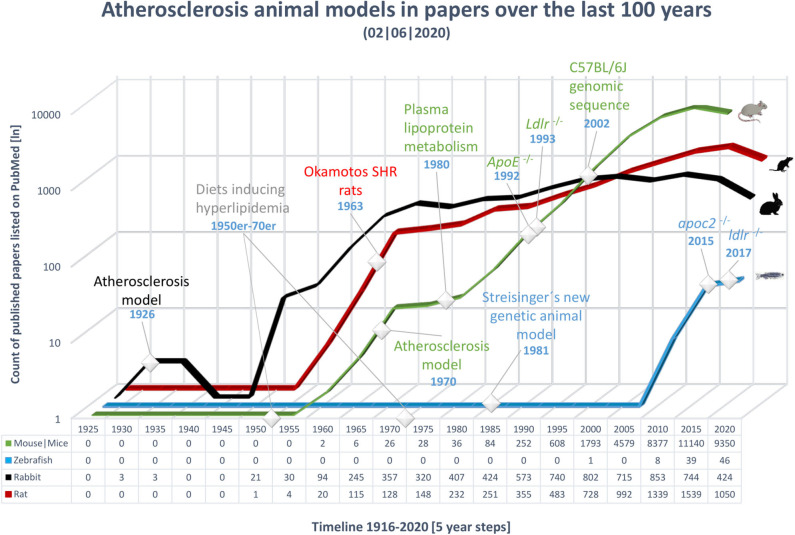
Figure 2.
Overview of publications over the last 100 years on the topic of atherosclerosis in various animal models. The x-axis shows time, from 1921 to 2018, in 5 year bins; the last time point includes only 3 years. The most important events in the history of atherosclerosis research have been marked. The y-axis shows the number of publications in PubMed, on a logarithmic scale; an exact count is shown below the timeline for each animal model. Results were gathered using the MeSH term atherosclerosis in combination with the model to include a wide range of publications. Black, rabbit; red, rat; green, mouse; blue, zebrafish.

