
Figure 1.
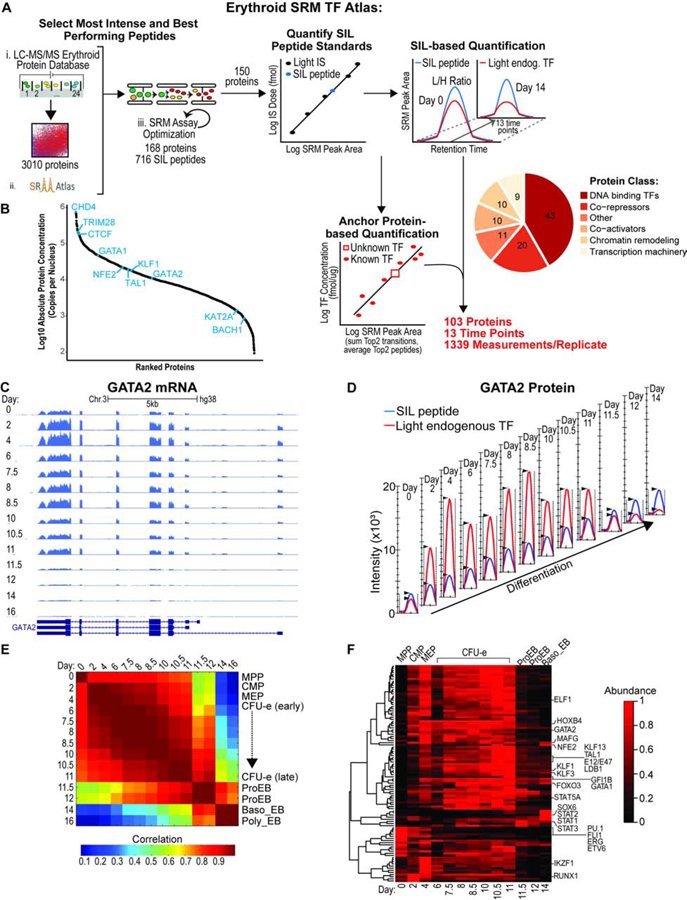
Absolute Quantification of Transcription Factors and Co-factors during Human Erythropoiesis.
(A) Schematic of SRM assay development to quantify TFs and cofactors during hemato/erythropoiesis. Absolute abundance was determined at each time-point using either the SIL-based or the Anchor protein–based quantification method. Two biological replicates were performed. SIL, stable isotope labeled; IS, internal standard.
(B) Range of protein abundances in the nucleus averaged for all time points.
(C) RNA-seq coverage of the GATA2 gene over time as displayed by the UCSC genome browser. Replicate 1 is shown as a representative example.
(D) Quantification of GATA2 protein over time by SRM. Ion chromatograms of endogenous (red) and SIL (blue) EVSPDPSTTGAASPASSSAGGSAAR peptide from the Skyline software. Replicate 1 is shown as a representative example.
(E) Correlation matrix between RNA-seq experiments at the indicated days. The heatmap displays Pearson correlations. Stages of differentiation (indicated on the right) were attributed to the time-points using CyTOF as previously described (Palii et al., 2019).
(F) k-means clustering analysis of normalized protein abundances at the indicated days. Protein abundances were measured by SRM and are shown as a heatmap after normalization.
See also Figures S1, S2, S3, Data S1 and Tables S1, S2, S3, S4.