
Figure 4.
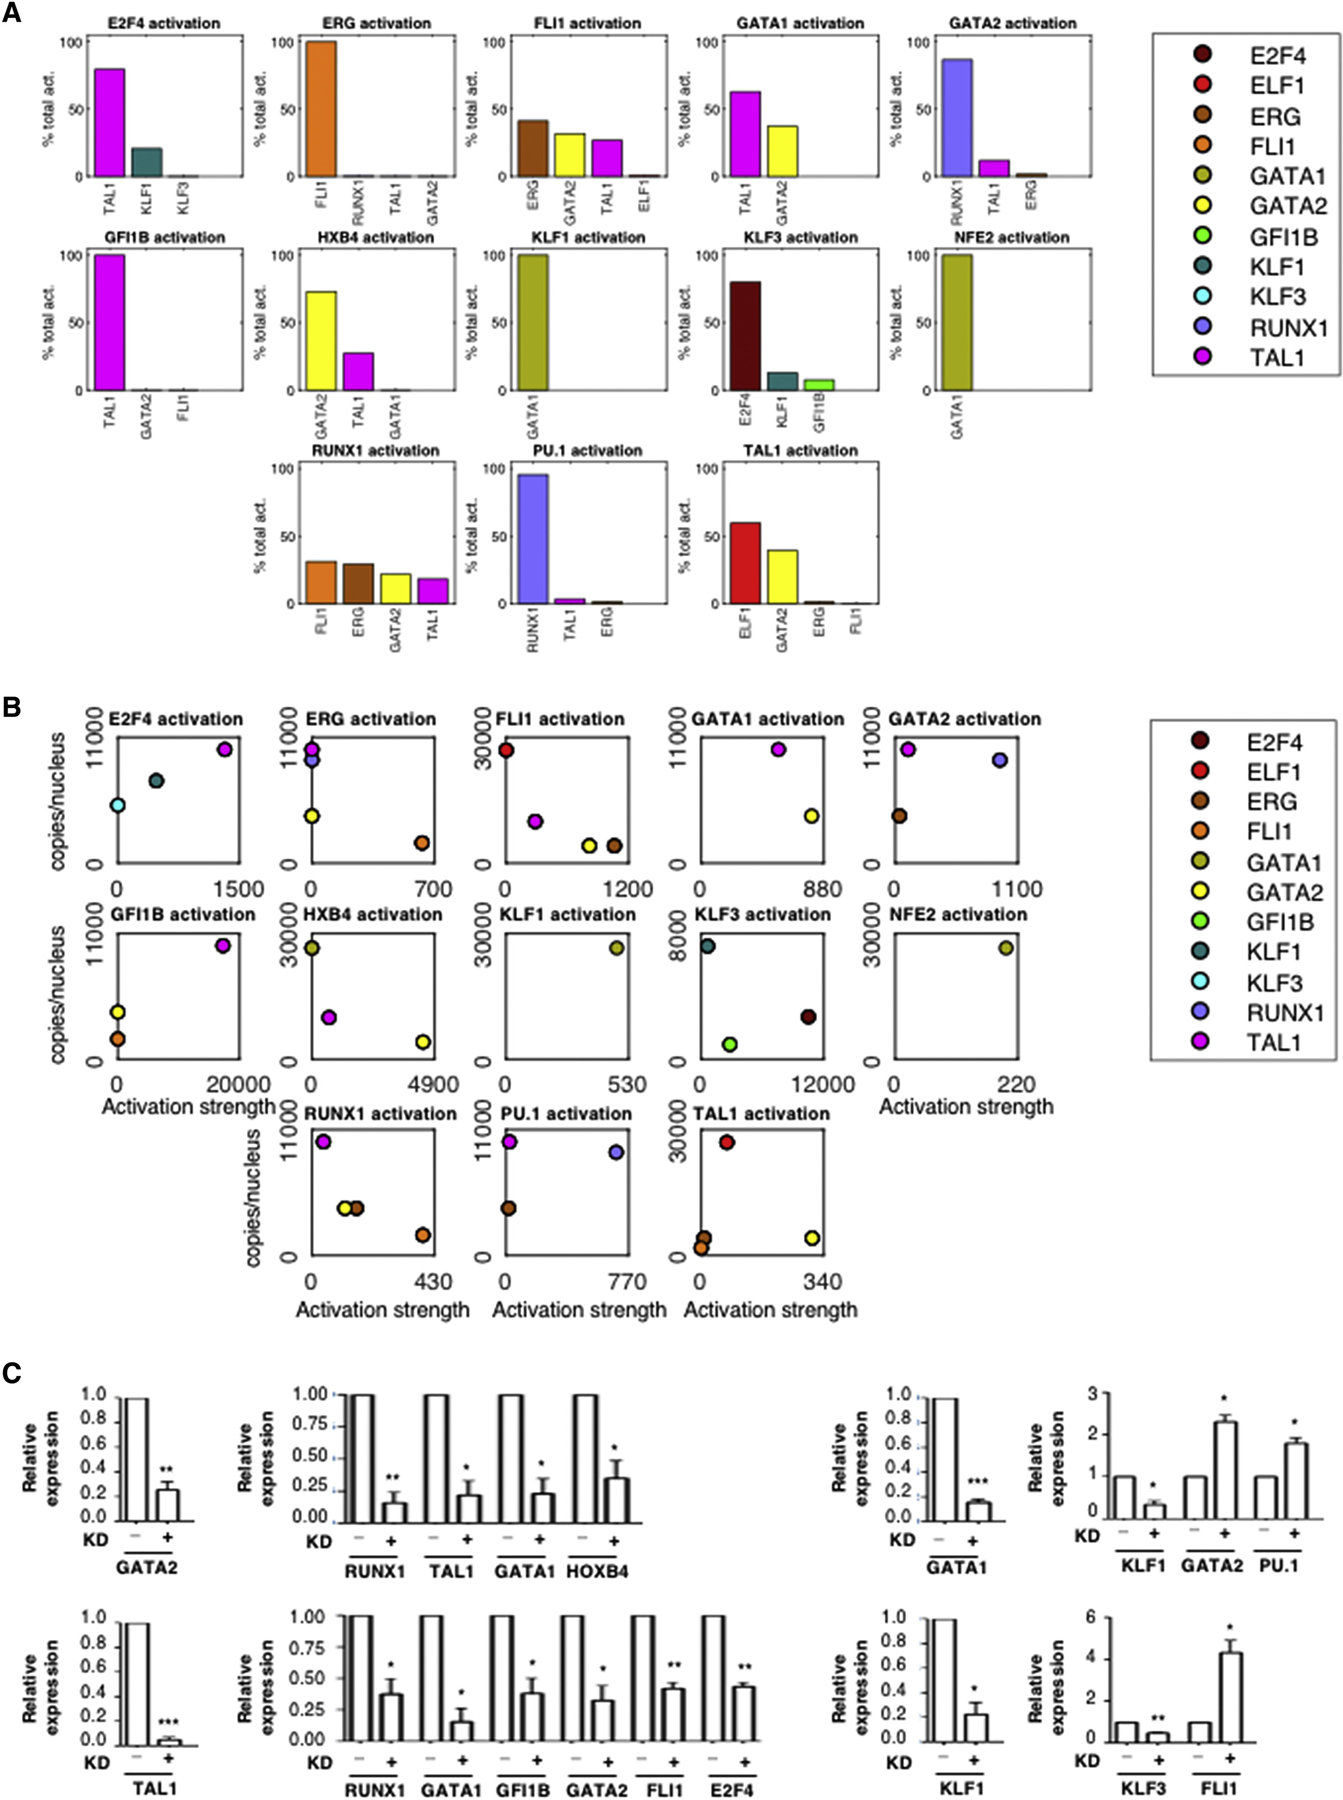
Quantitative Regulatory Relationships
(A) Relative contribution of each TF to the activation of its targets within the GRN. The average activation of a regulator X on target gene Y is computed as AX*KXY, where AX is the average protein expression of gene X over the days 0, 2, 4, 6, 8 and 10, and KXY is the GRN’s regulatory parameter quantifying its effect on gene Y. The activation percentage is AX*KXY divided by the sum of average activations from all activators of Y.
(B) The activation strength of each TF for its target gene is plotted relative to its abundance. For each gene Y in the GRN, the average protein abundance AX and regulatory parameter KXY are plotted for all activators X.
(C) The knockdowns of GATA1, GATA2, TAL1 and KLF1 were induced separately by lentiviral delivery of shRNA in cells at day 8. Expression of putative target genes was tested by qRT-PCR after 48h. Expression is shown relative to GAPDH as mean +/− standard error of the mean (SEM). n=3. Two-tailed t-test: * p < 0.05. **p < 0.01. *** p < 0.001.