
Figure 5.
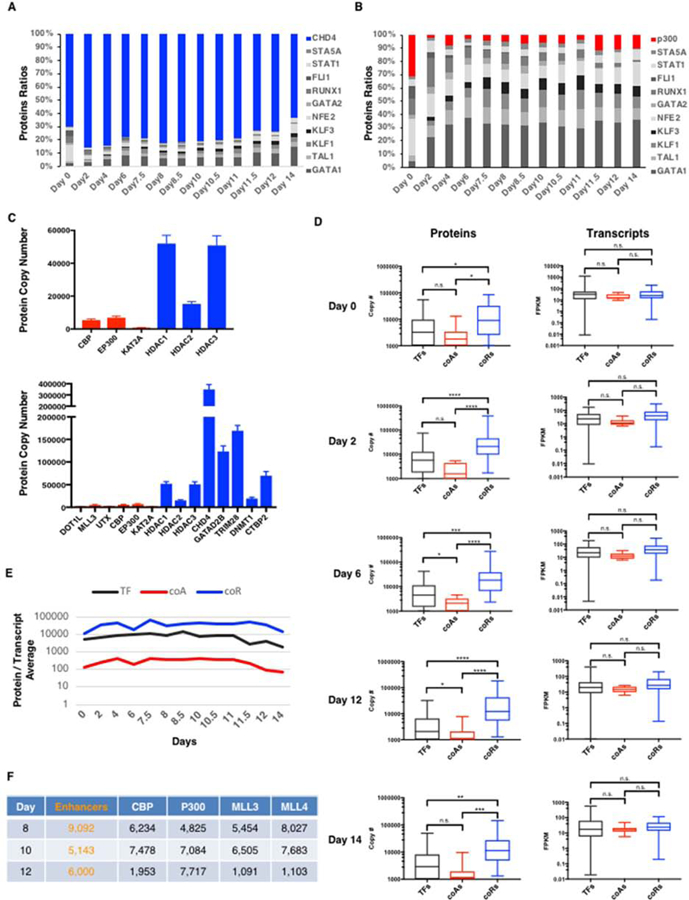
Large Excess of Co-Repressors and Limiting Amounts of Co-Activators in the Nucleus.
(A) Relative abundance of CHD4 protein compared to 10 erythroid TFs.
(B) Relative abundance of P300 protein compared to 10 erythroid TFs.
(C) Top panel: Quantitative imbalance between histone acetyltransferases (in red) and histone deacetylases (in blue). Bottom panel: Quantitative imbalance between co-activators (in red) and co-repressors (in blue).
(D) Left panel: Box plots depicting protein abundances (in copy numbers) of transcription factors (TFs, black), co-activators (coAs, red) and co-repressors (coRs, blue) at the indicated days. Right panel: Box plots depicting mRNA abundances (in FPKM) of TFs, coAs and coRs at the indicated days. For a list of TF, coA and coR, see Table S4. Two-tailed t-test: n.s. (non-significant), * p < 0.05. **p < 0.01. *** p < 0.001. **** p < 0.0001.
(E) Average of protein/transcript ratio for TFs, coAs and coRs at each day of differentiation.
(F) Estimated number of active enhancers compared to protein copy numbers of the indicated coAs in the nucleus at the indicated days.
See also Figure S4.