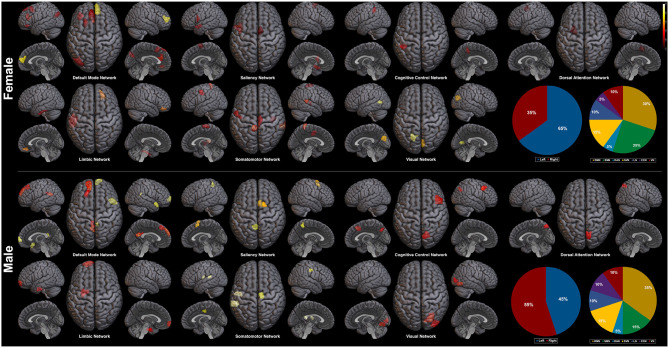
Figure 6.
Saliency mapping result of the proposed method. Top 20 salient regions are plotted with respect to the Yeo 7 networks (Thomas Yeo et al., 2011). The pie charts indicate the ratio of the two hemispheres and the ratio of each networks across the salient regions.

